Peach Industry survey Cultivar inventory & harvest timing

MDARD rotational survey · 2011–2022

Cultivar inventory & harvest timing

How Michigan peach acreage is distributed across the harvest calendar, how that mix changed from 2011 to 2022, and how dependent the industry remains on Redhaven.

  • Commercial growers
  • Updated 2026-07-22
  • Michigan Department of Agriculture and Rural Development (MDARD) Fruit Inventory

Download chapter PDF

These figures describe how Michigan peach acreage is distributed across the harvest season, how the cultivar portfolio shifted between rotational inventories, and where maturity-timing data are complete versus incomplete.
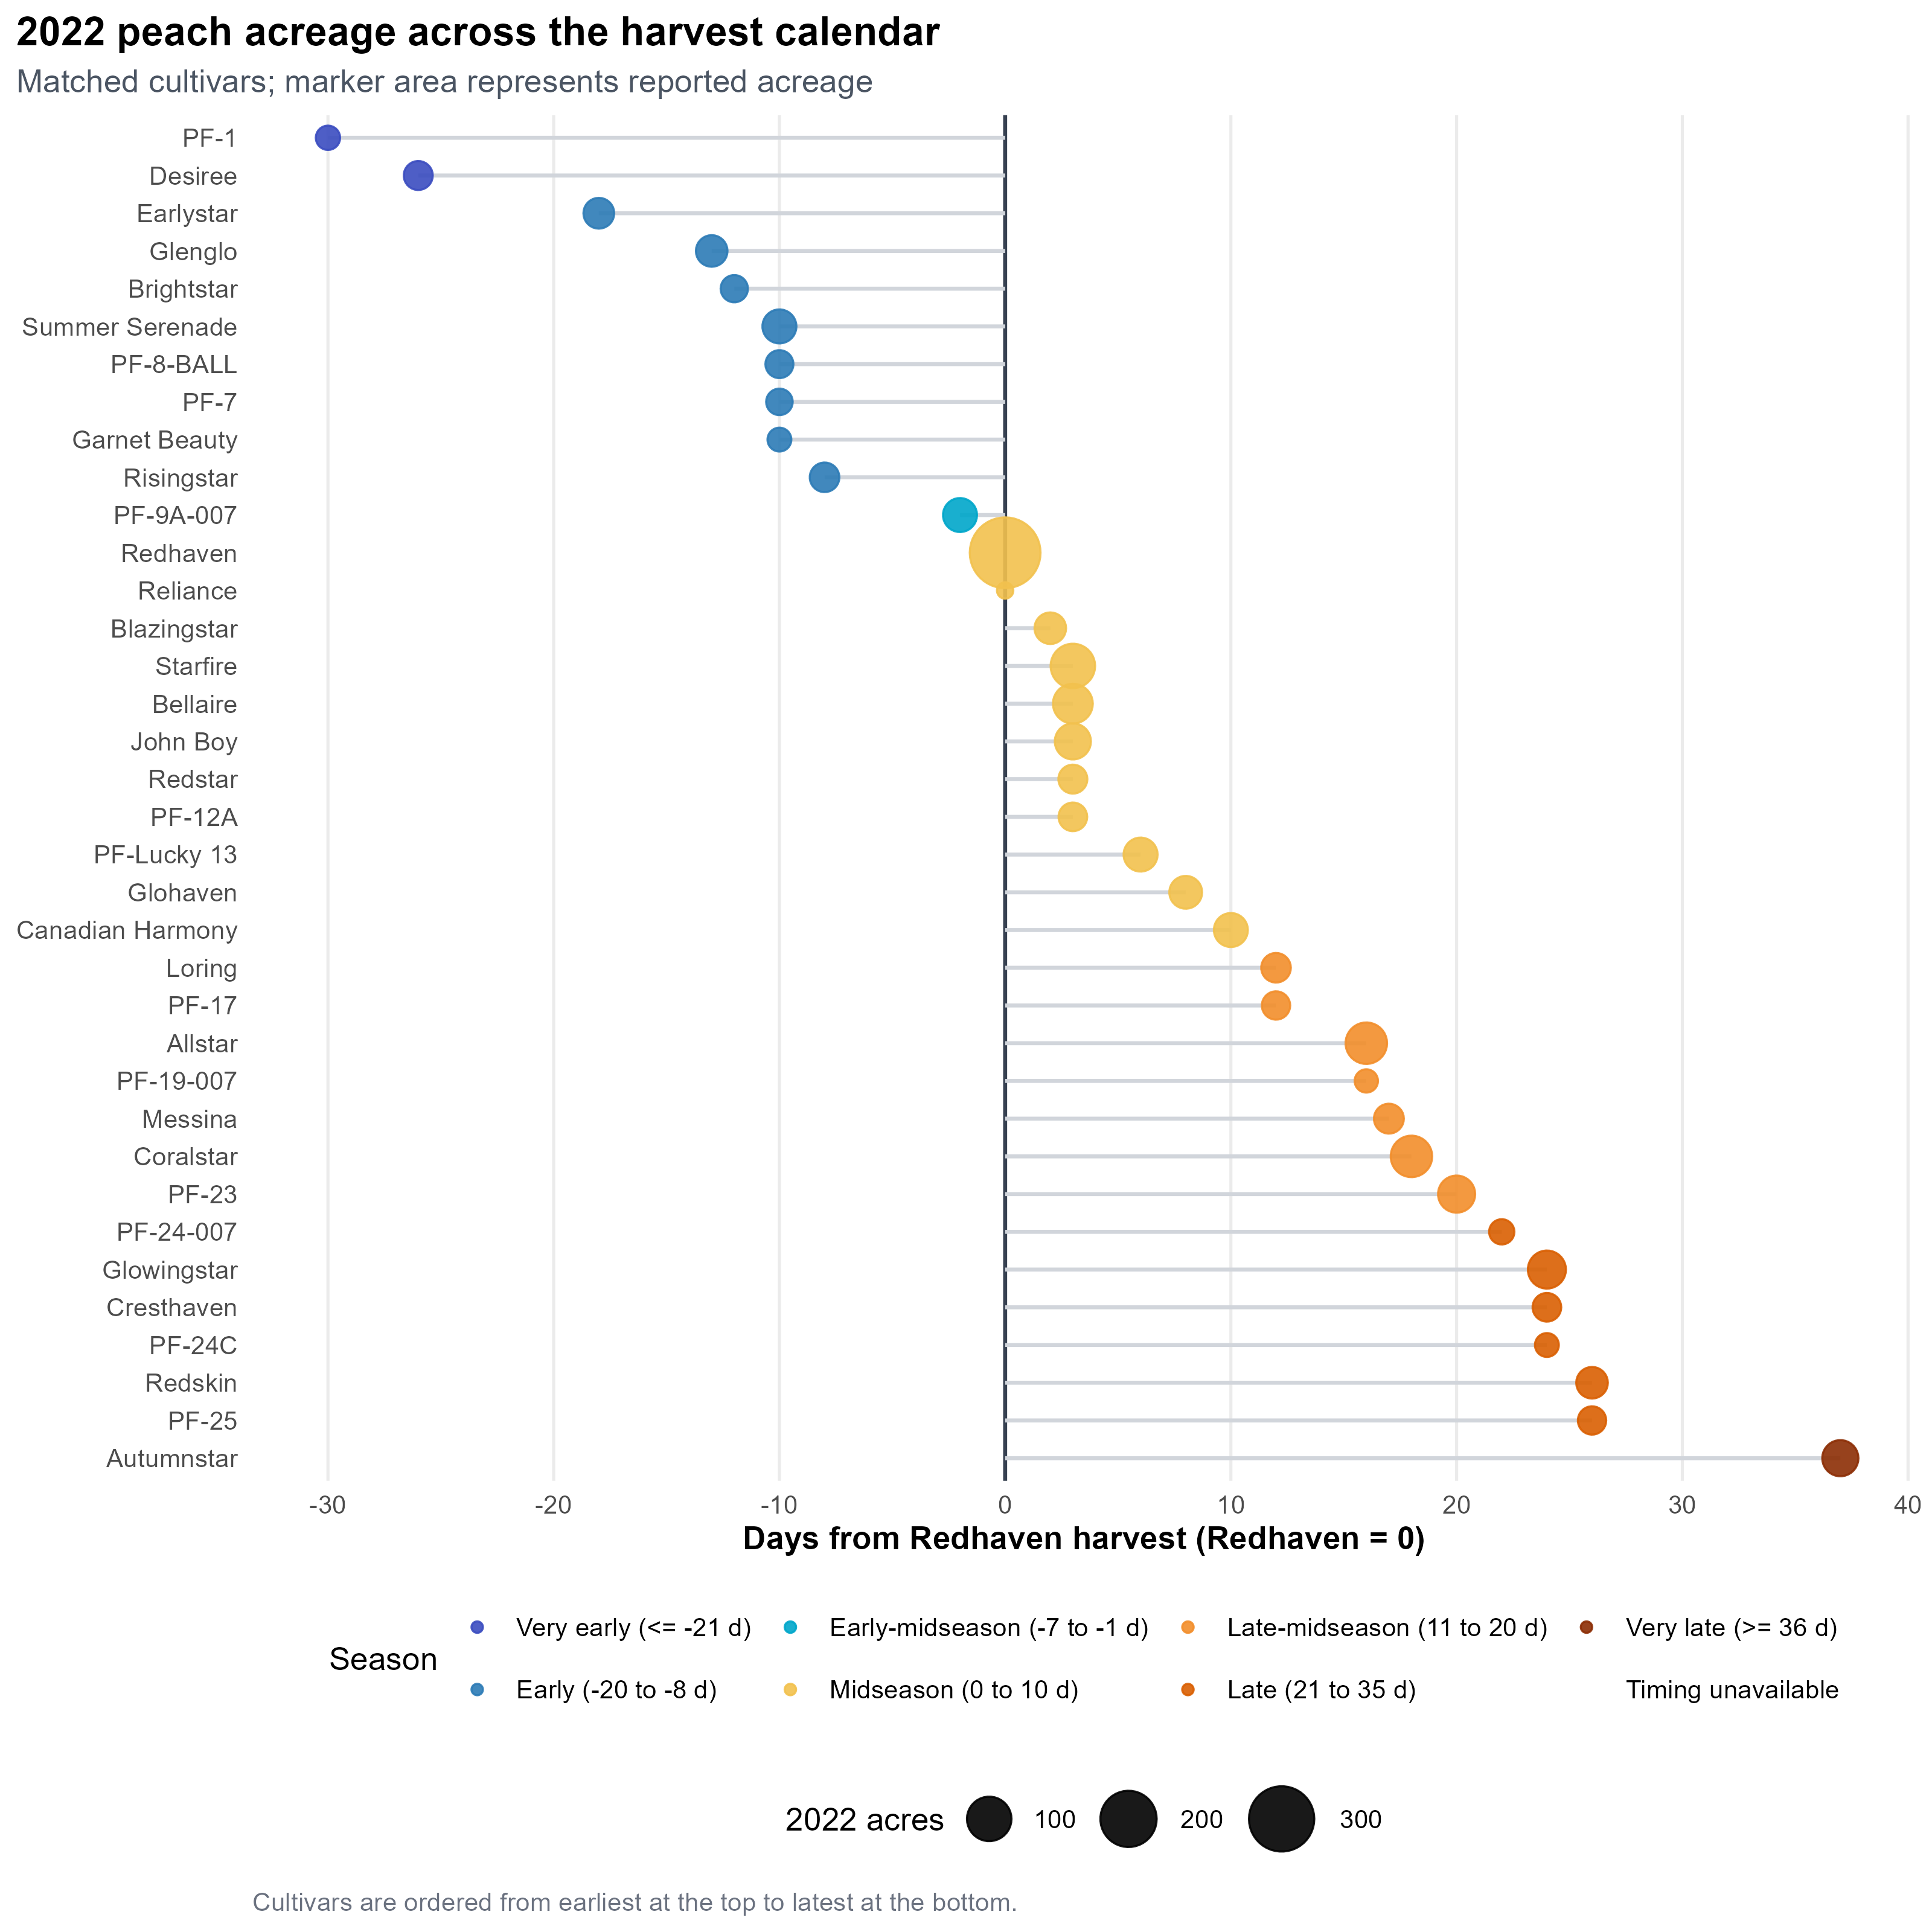
2022 peach acreage across the harvest calendar
2022 peach acreage across the harvest calendar. Matched cultivars with known maturity timing. Marker area represents reported acreage.
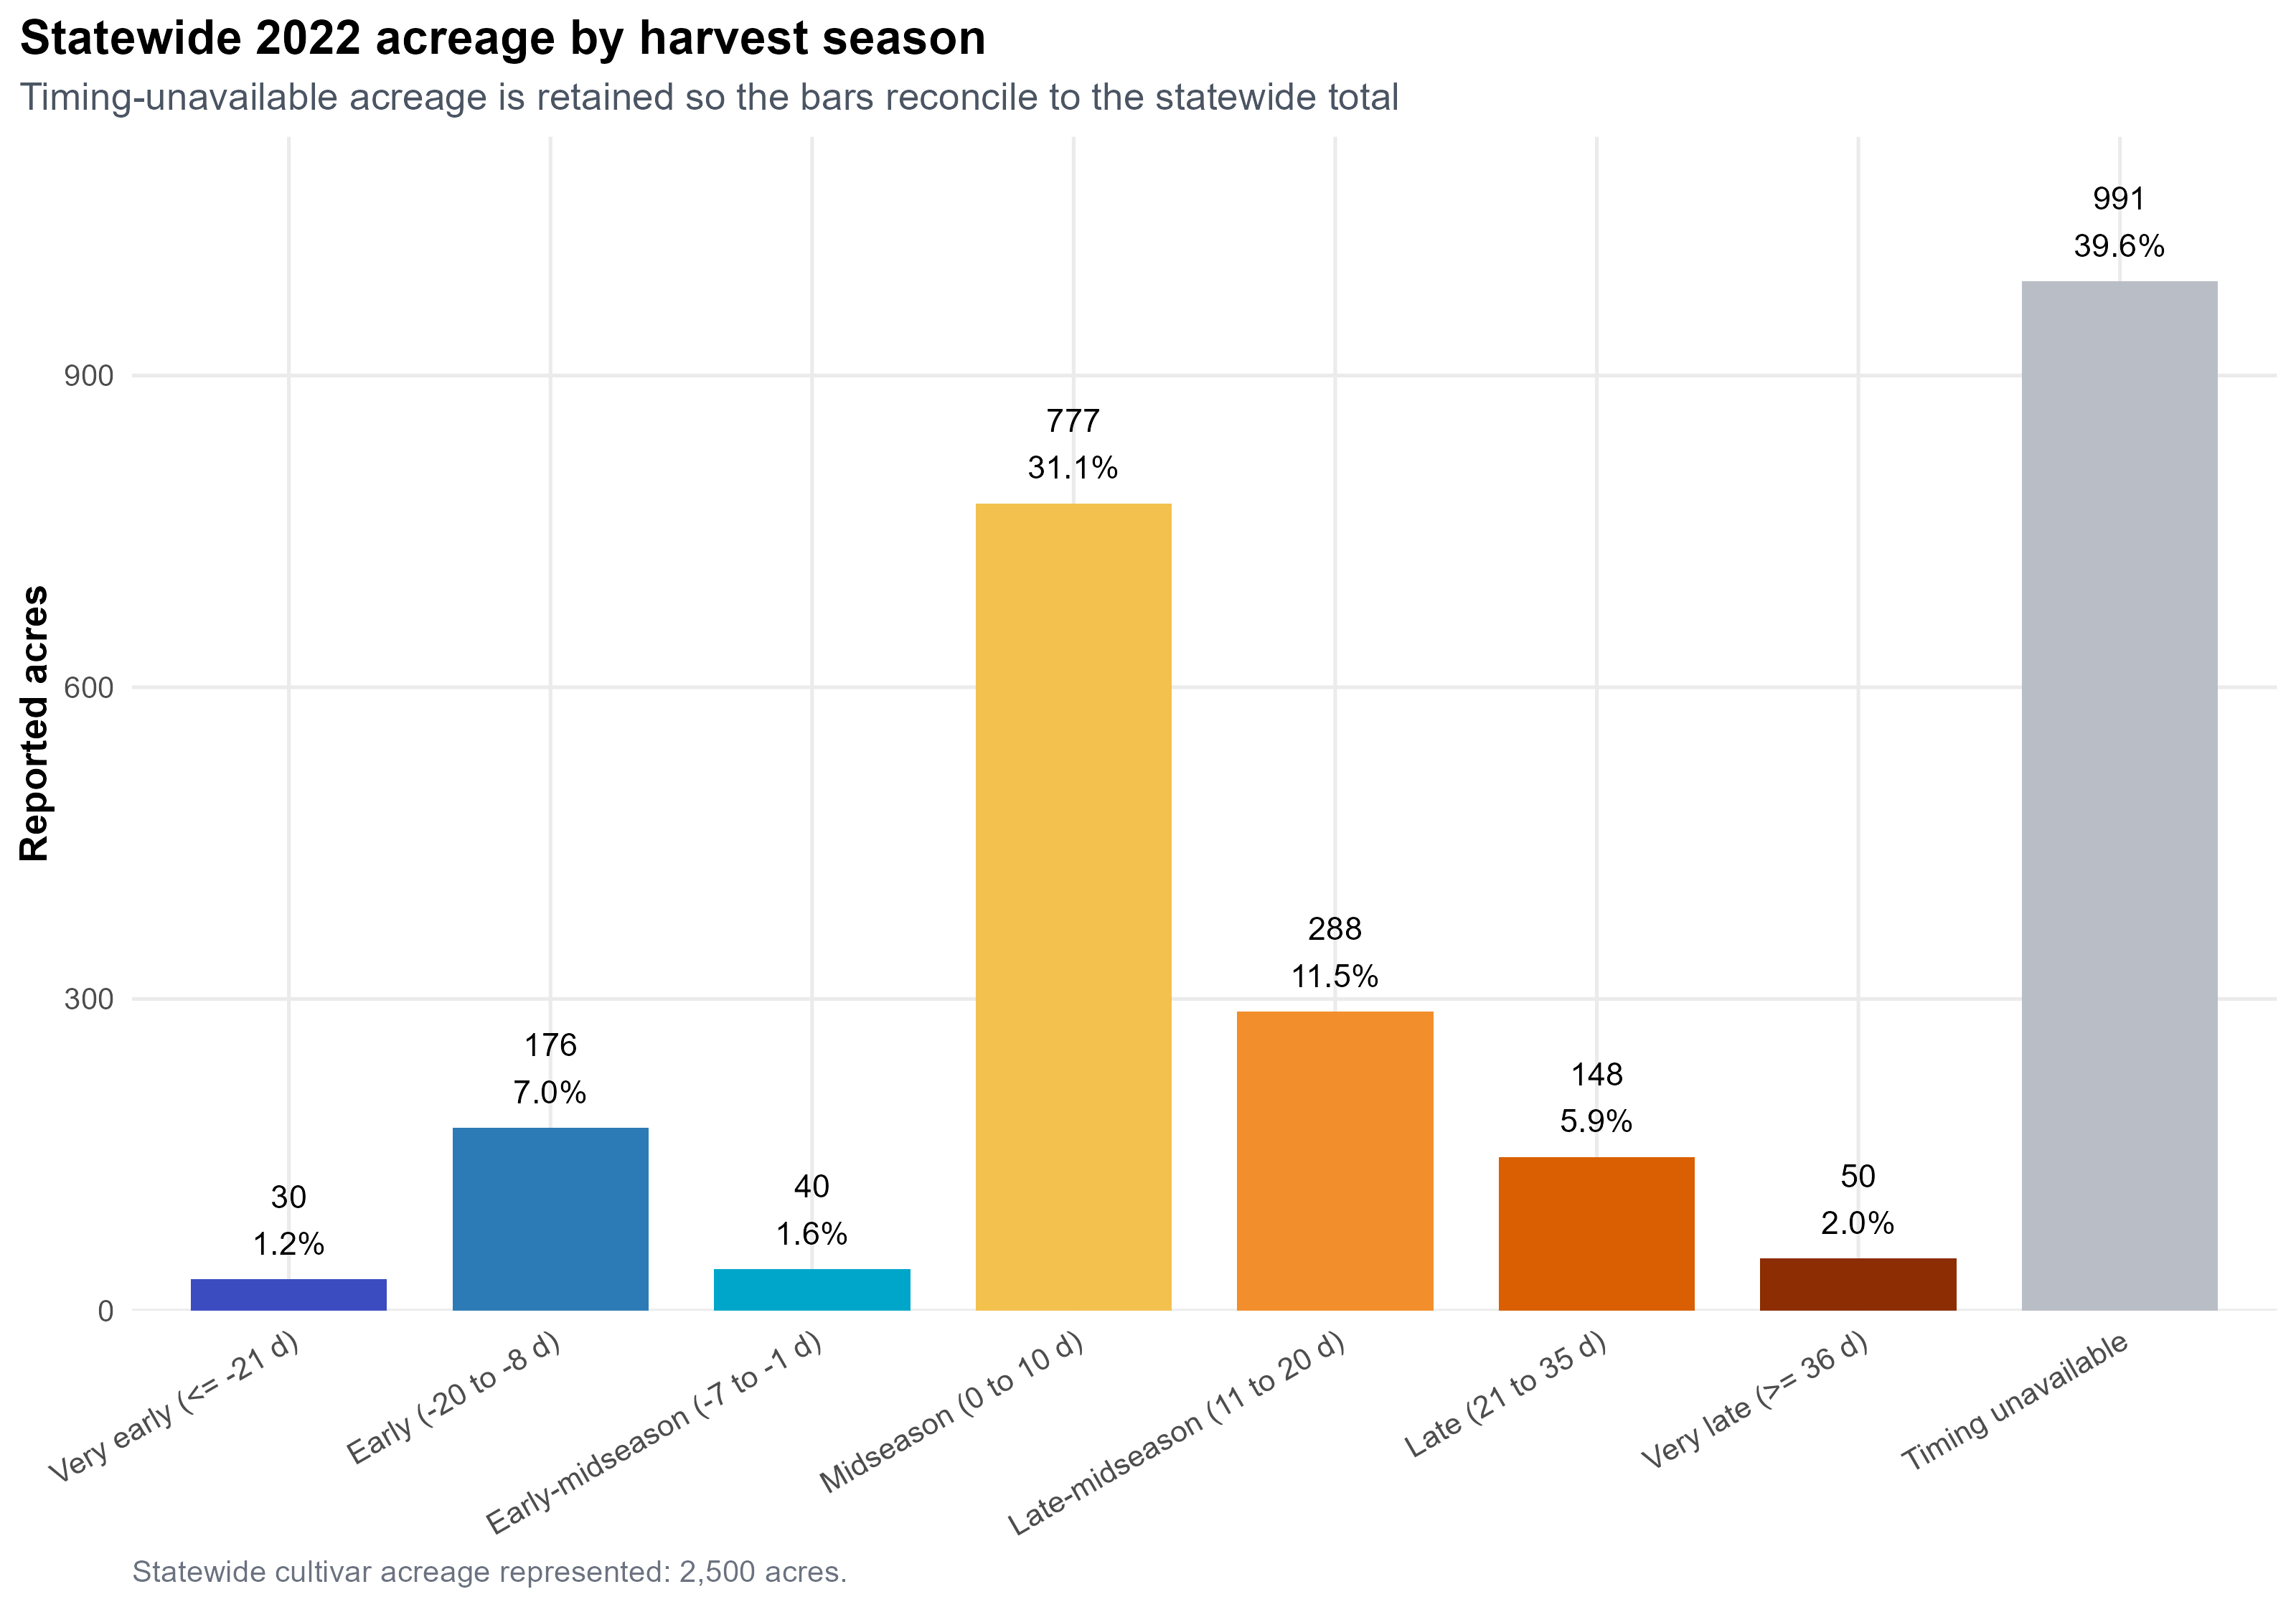
Statewide 2022 acreage by harvest season
Statewide 2022 acreage by harvest season. Timing-unavailable acreage is retained so the bars reconcile to the statewide total.
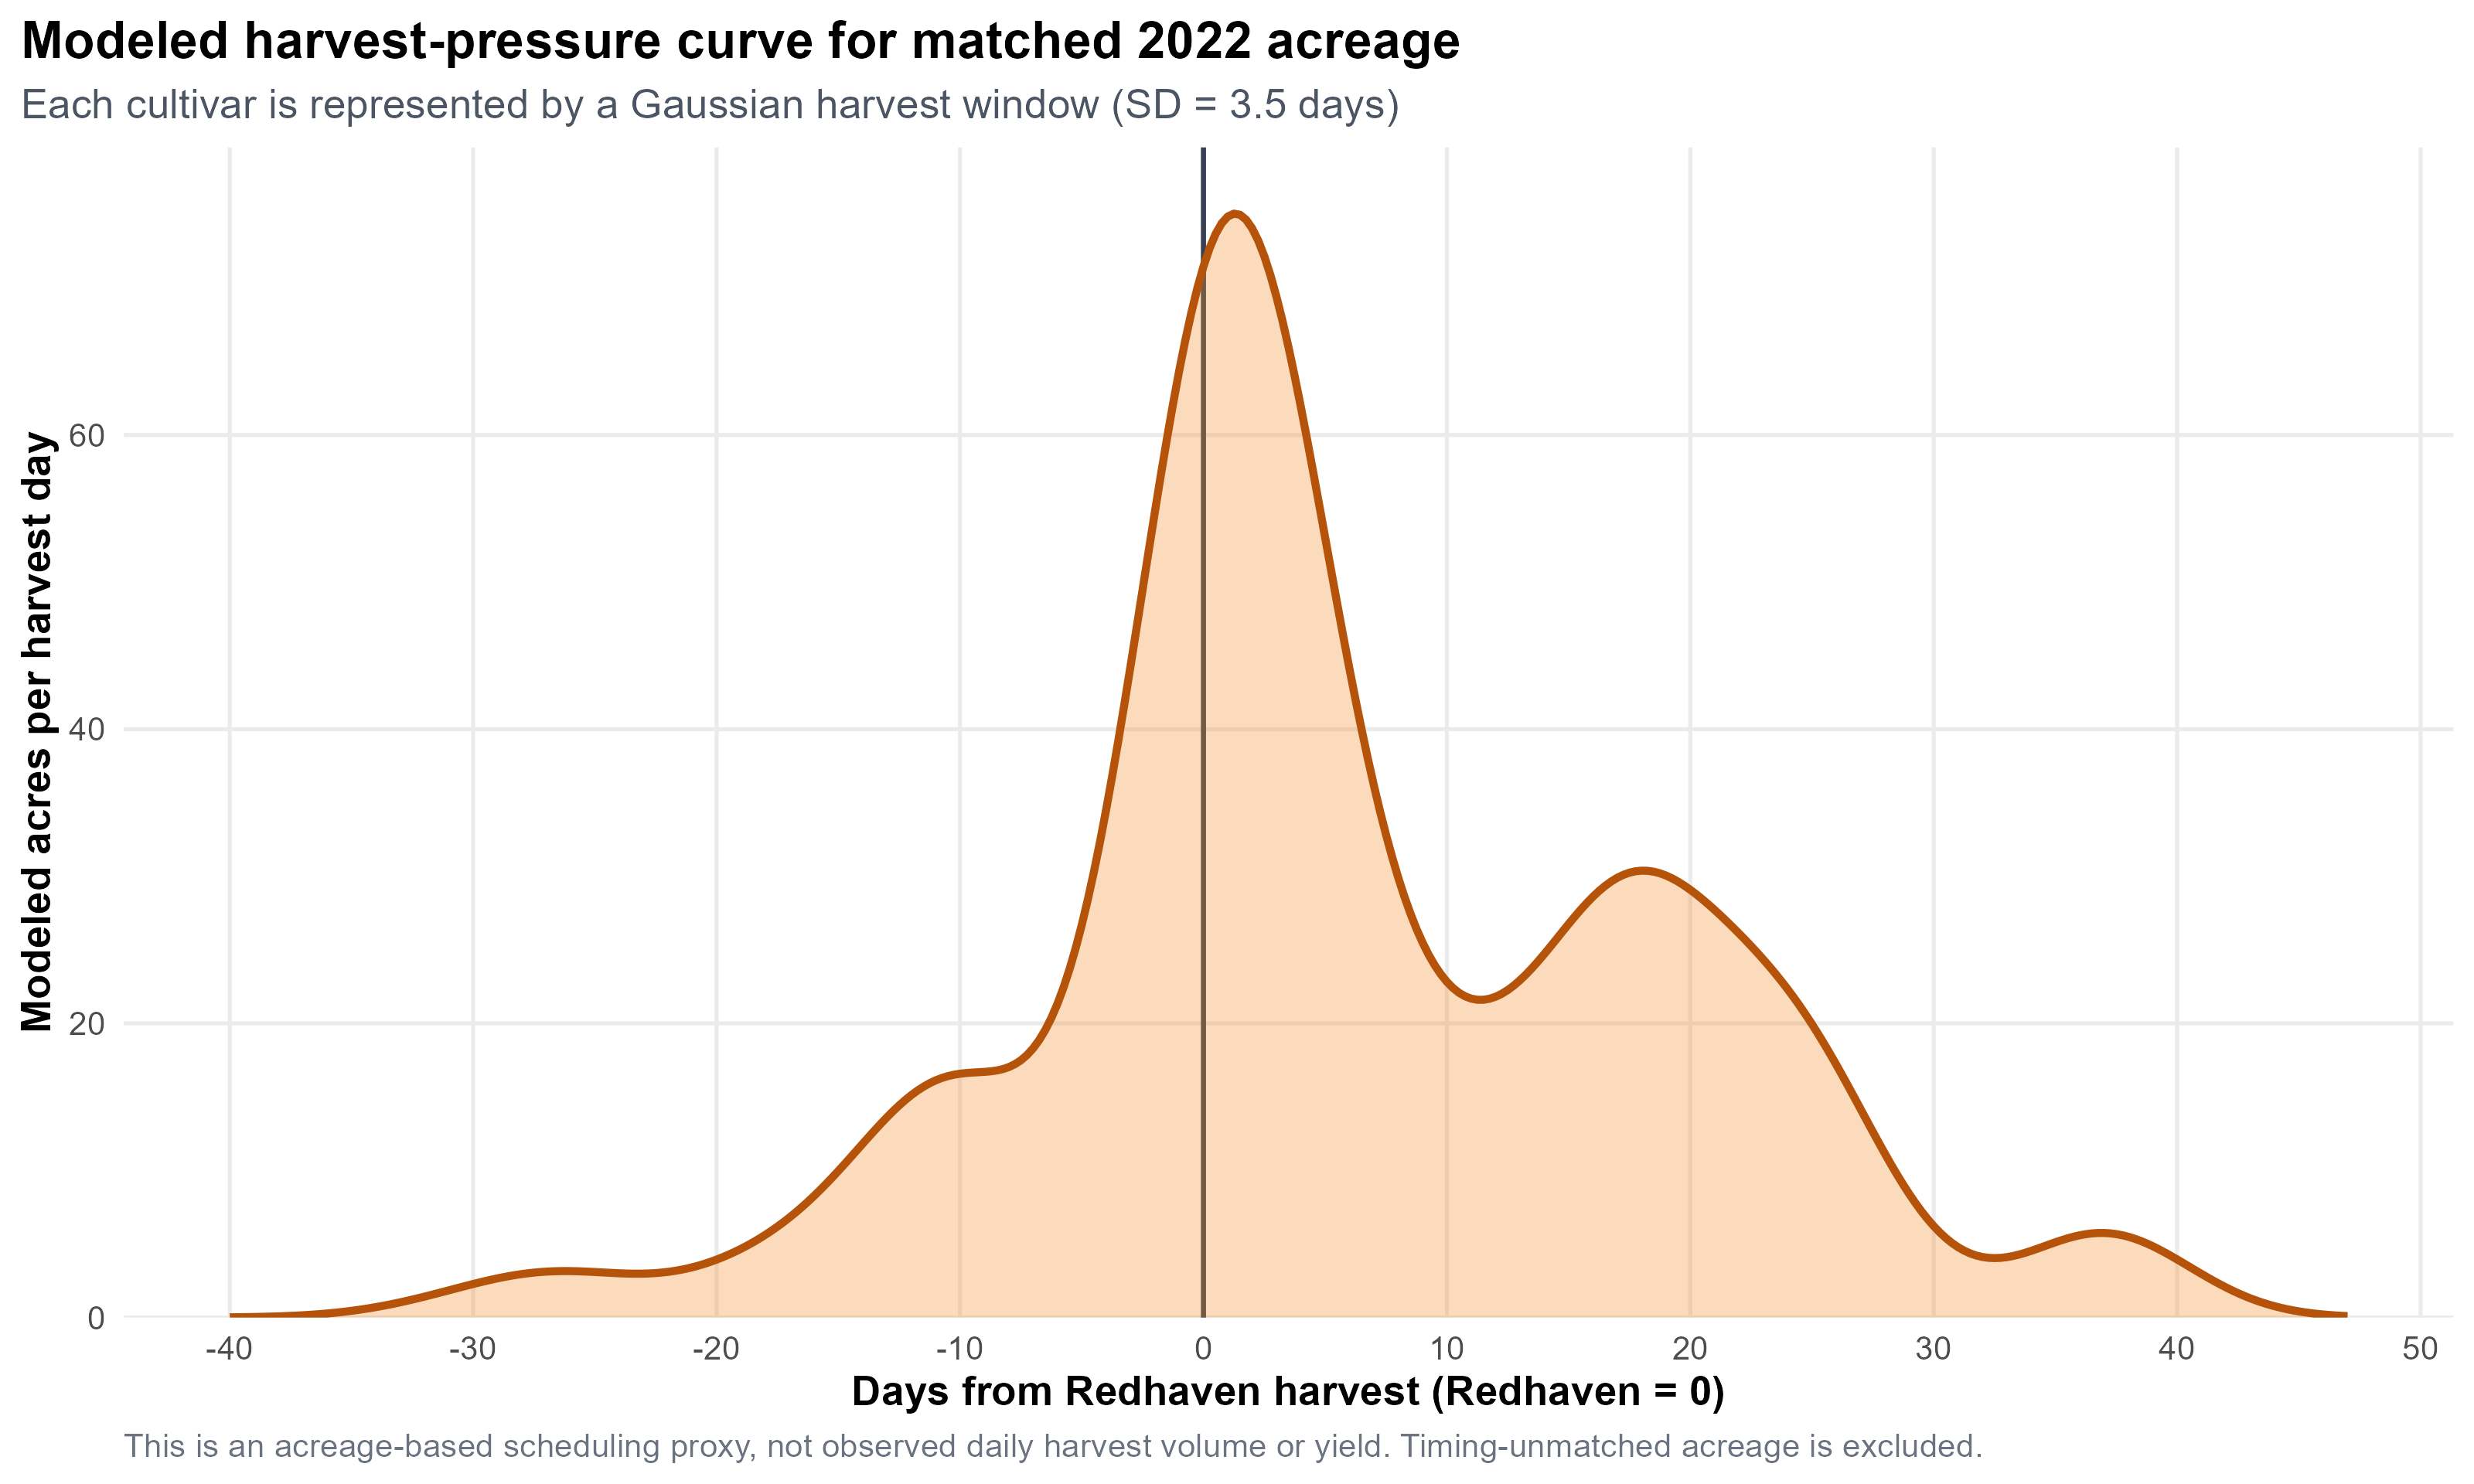
Modeled harvest-pressure curve for matched 2022 acreage
Modeled harvest-pressure curve for matched 2022 acreage. Each cultivar is represented by a Gaussian harvest window centered on its Redhaven offset.
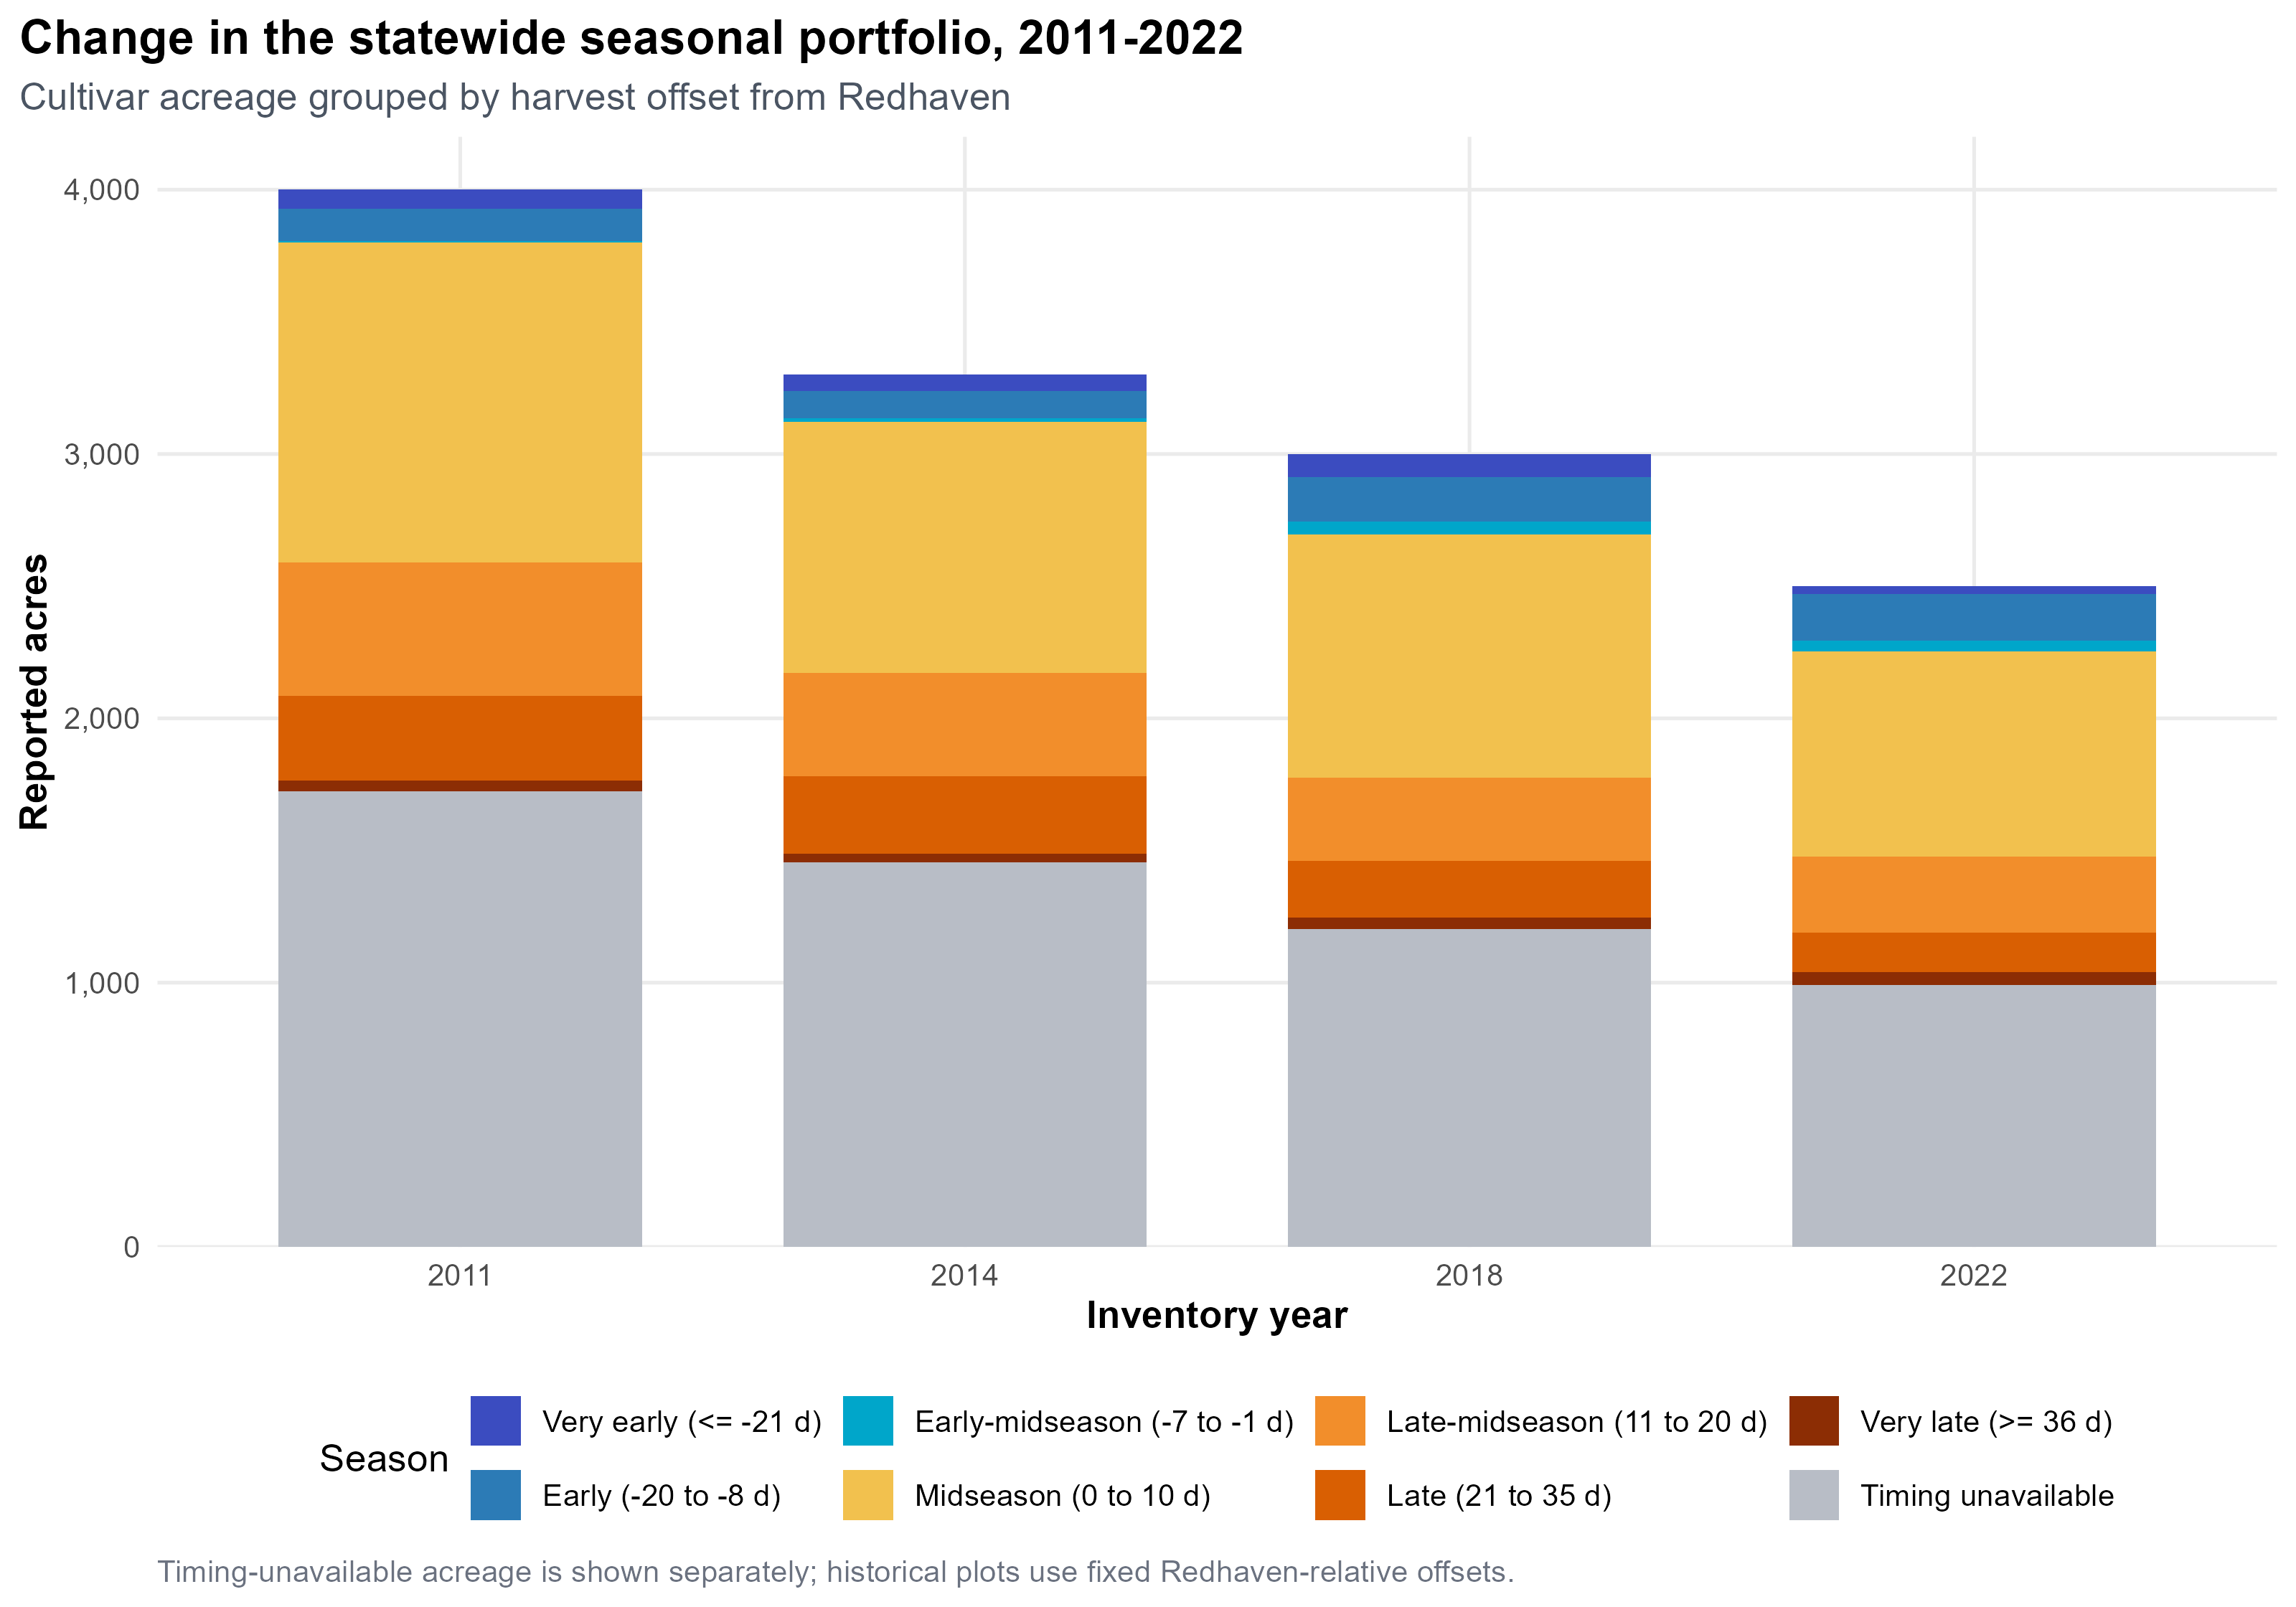
Change in the statewide seasonal portfolio, 2011–2022
Change in the statewide seasonal portfolio, 2011–2022. Cultivar acreage grouped by harvest offset from Redhaven.
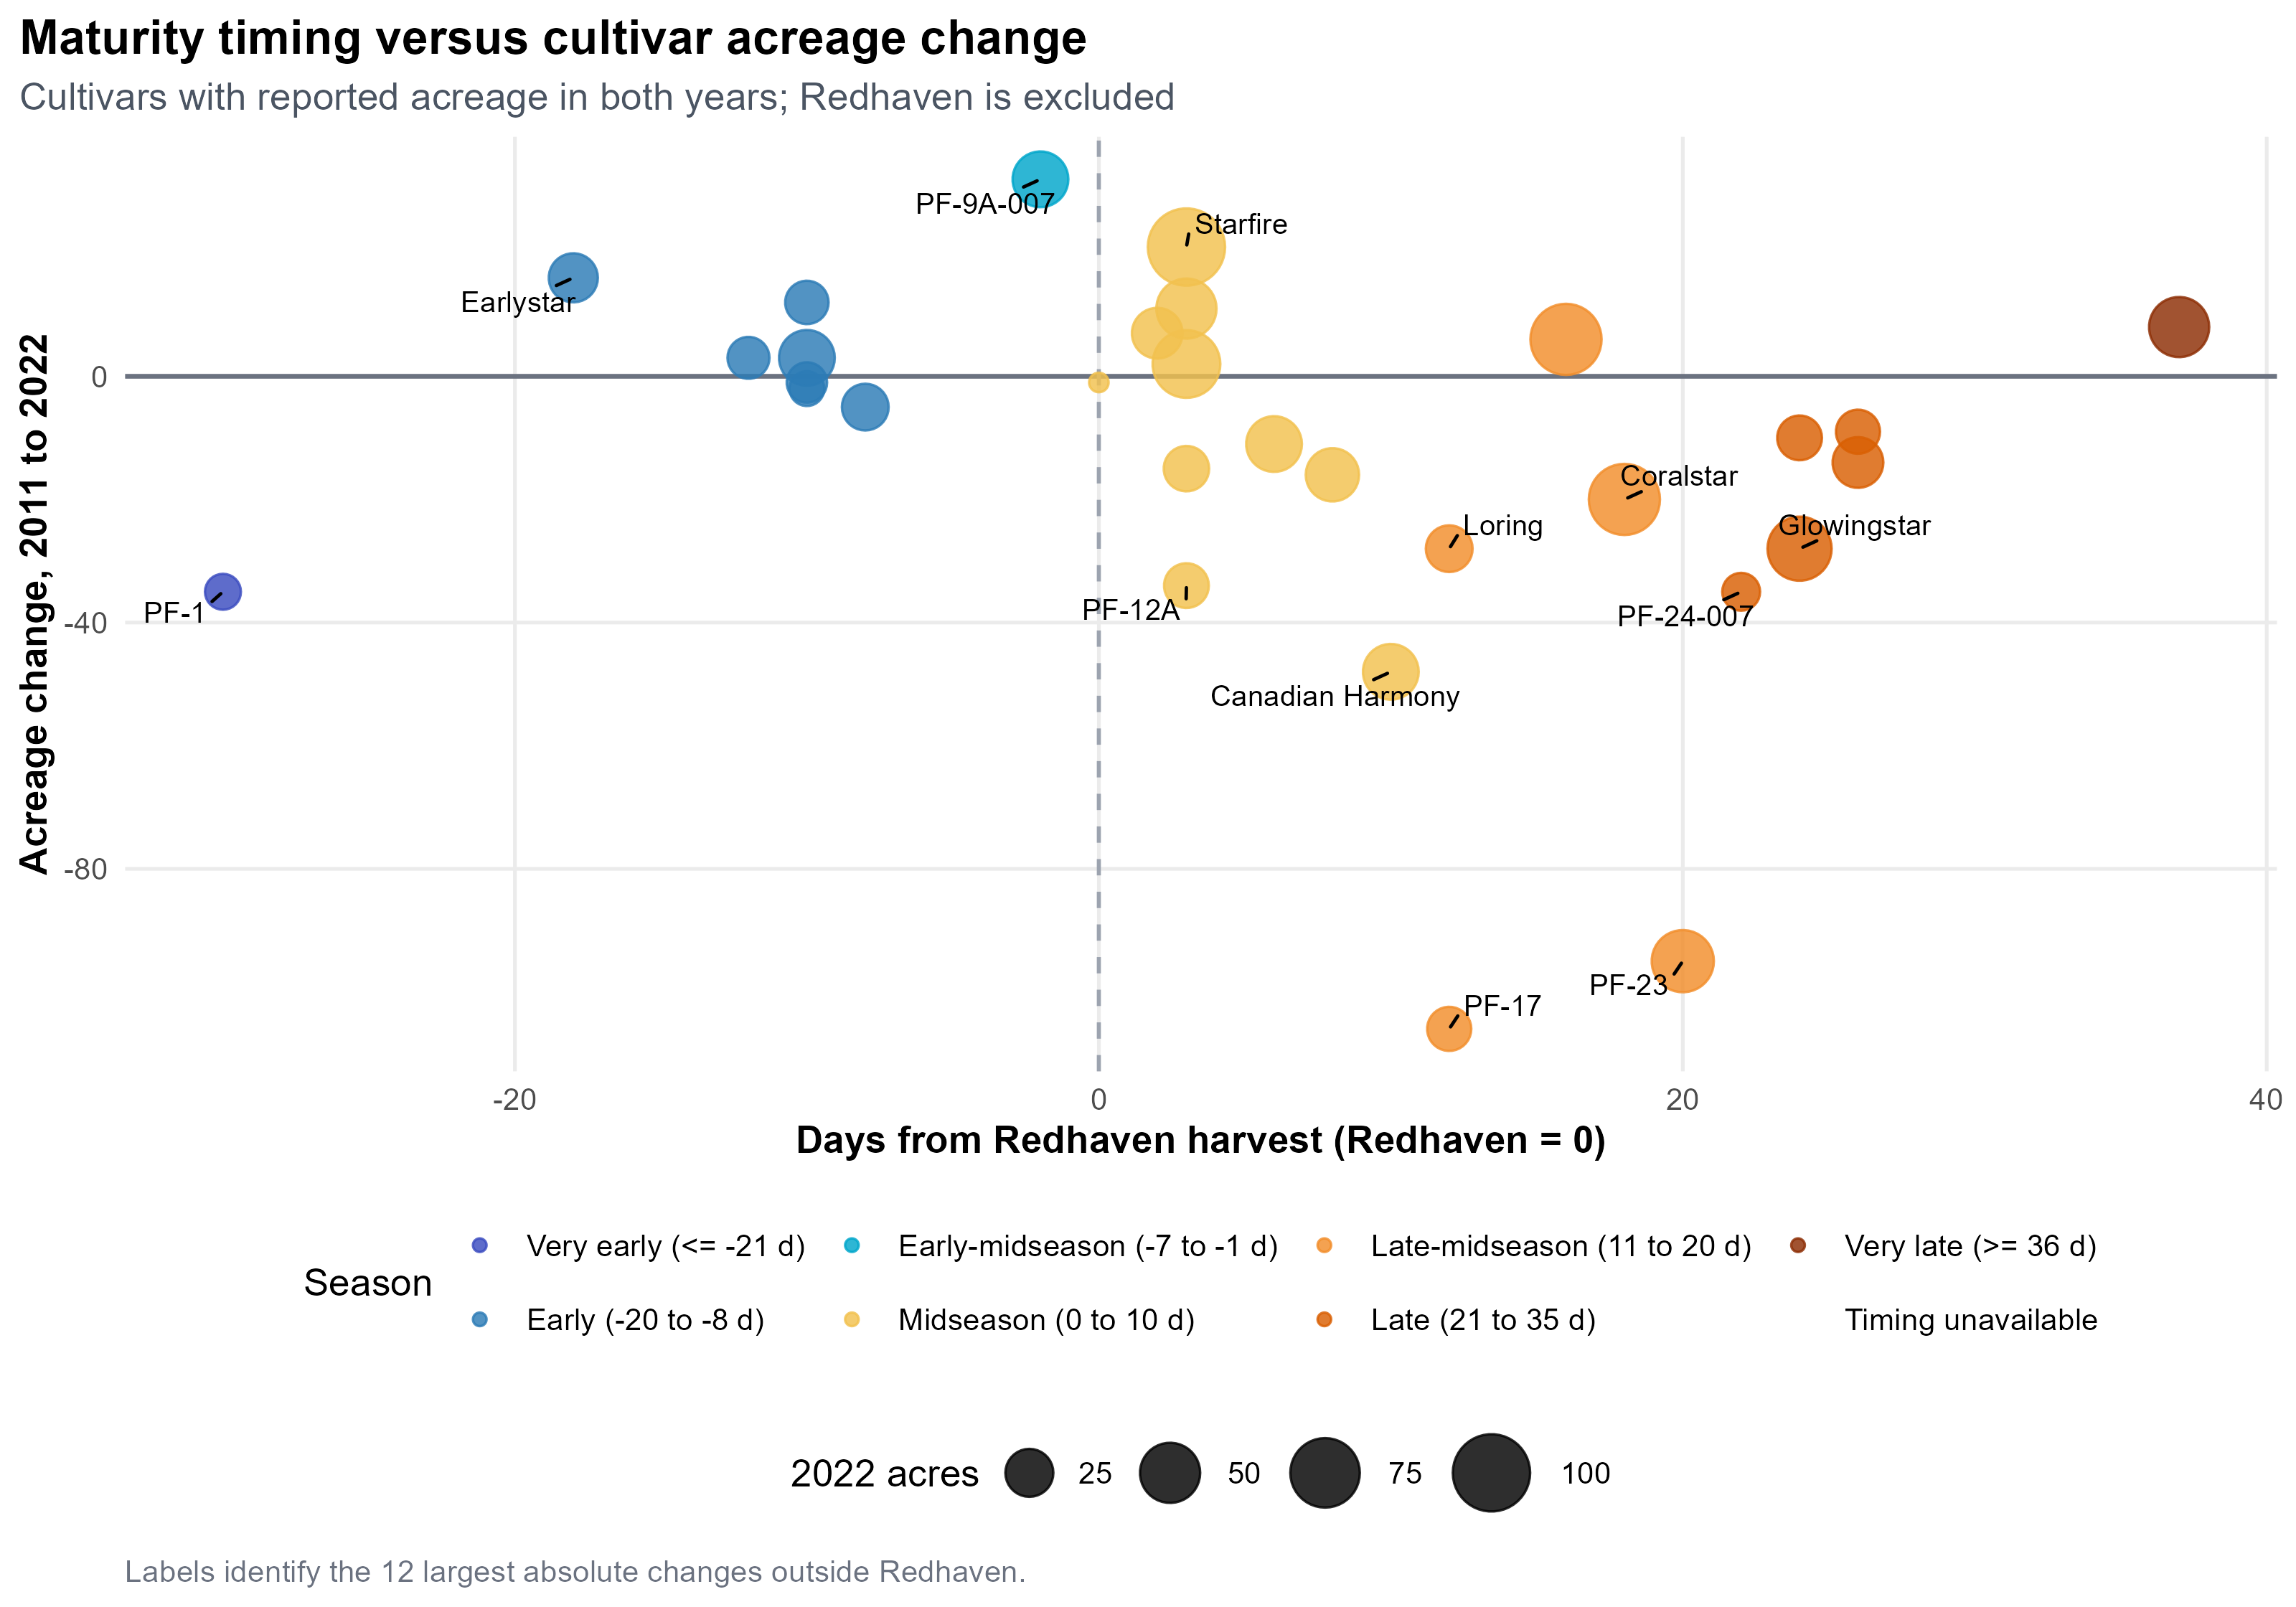
Maturity timing versus cultivar acreage change
Maturity timing versus cultivar acreage change. Cultivars with reported acreage in both years; Redhaven is excluded.
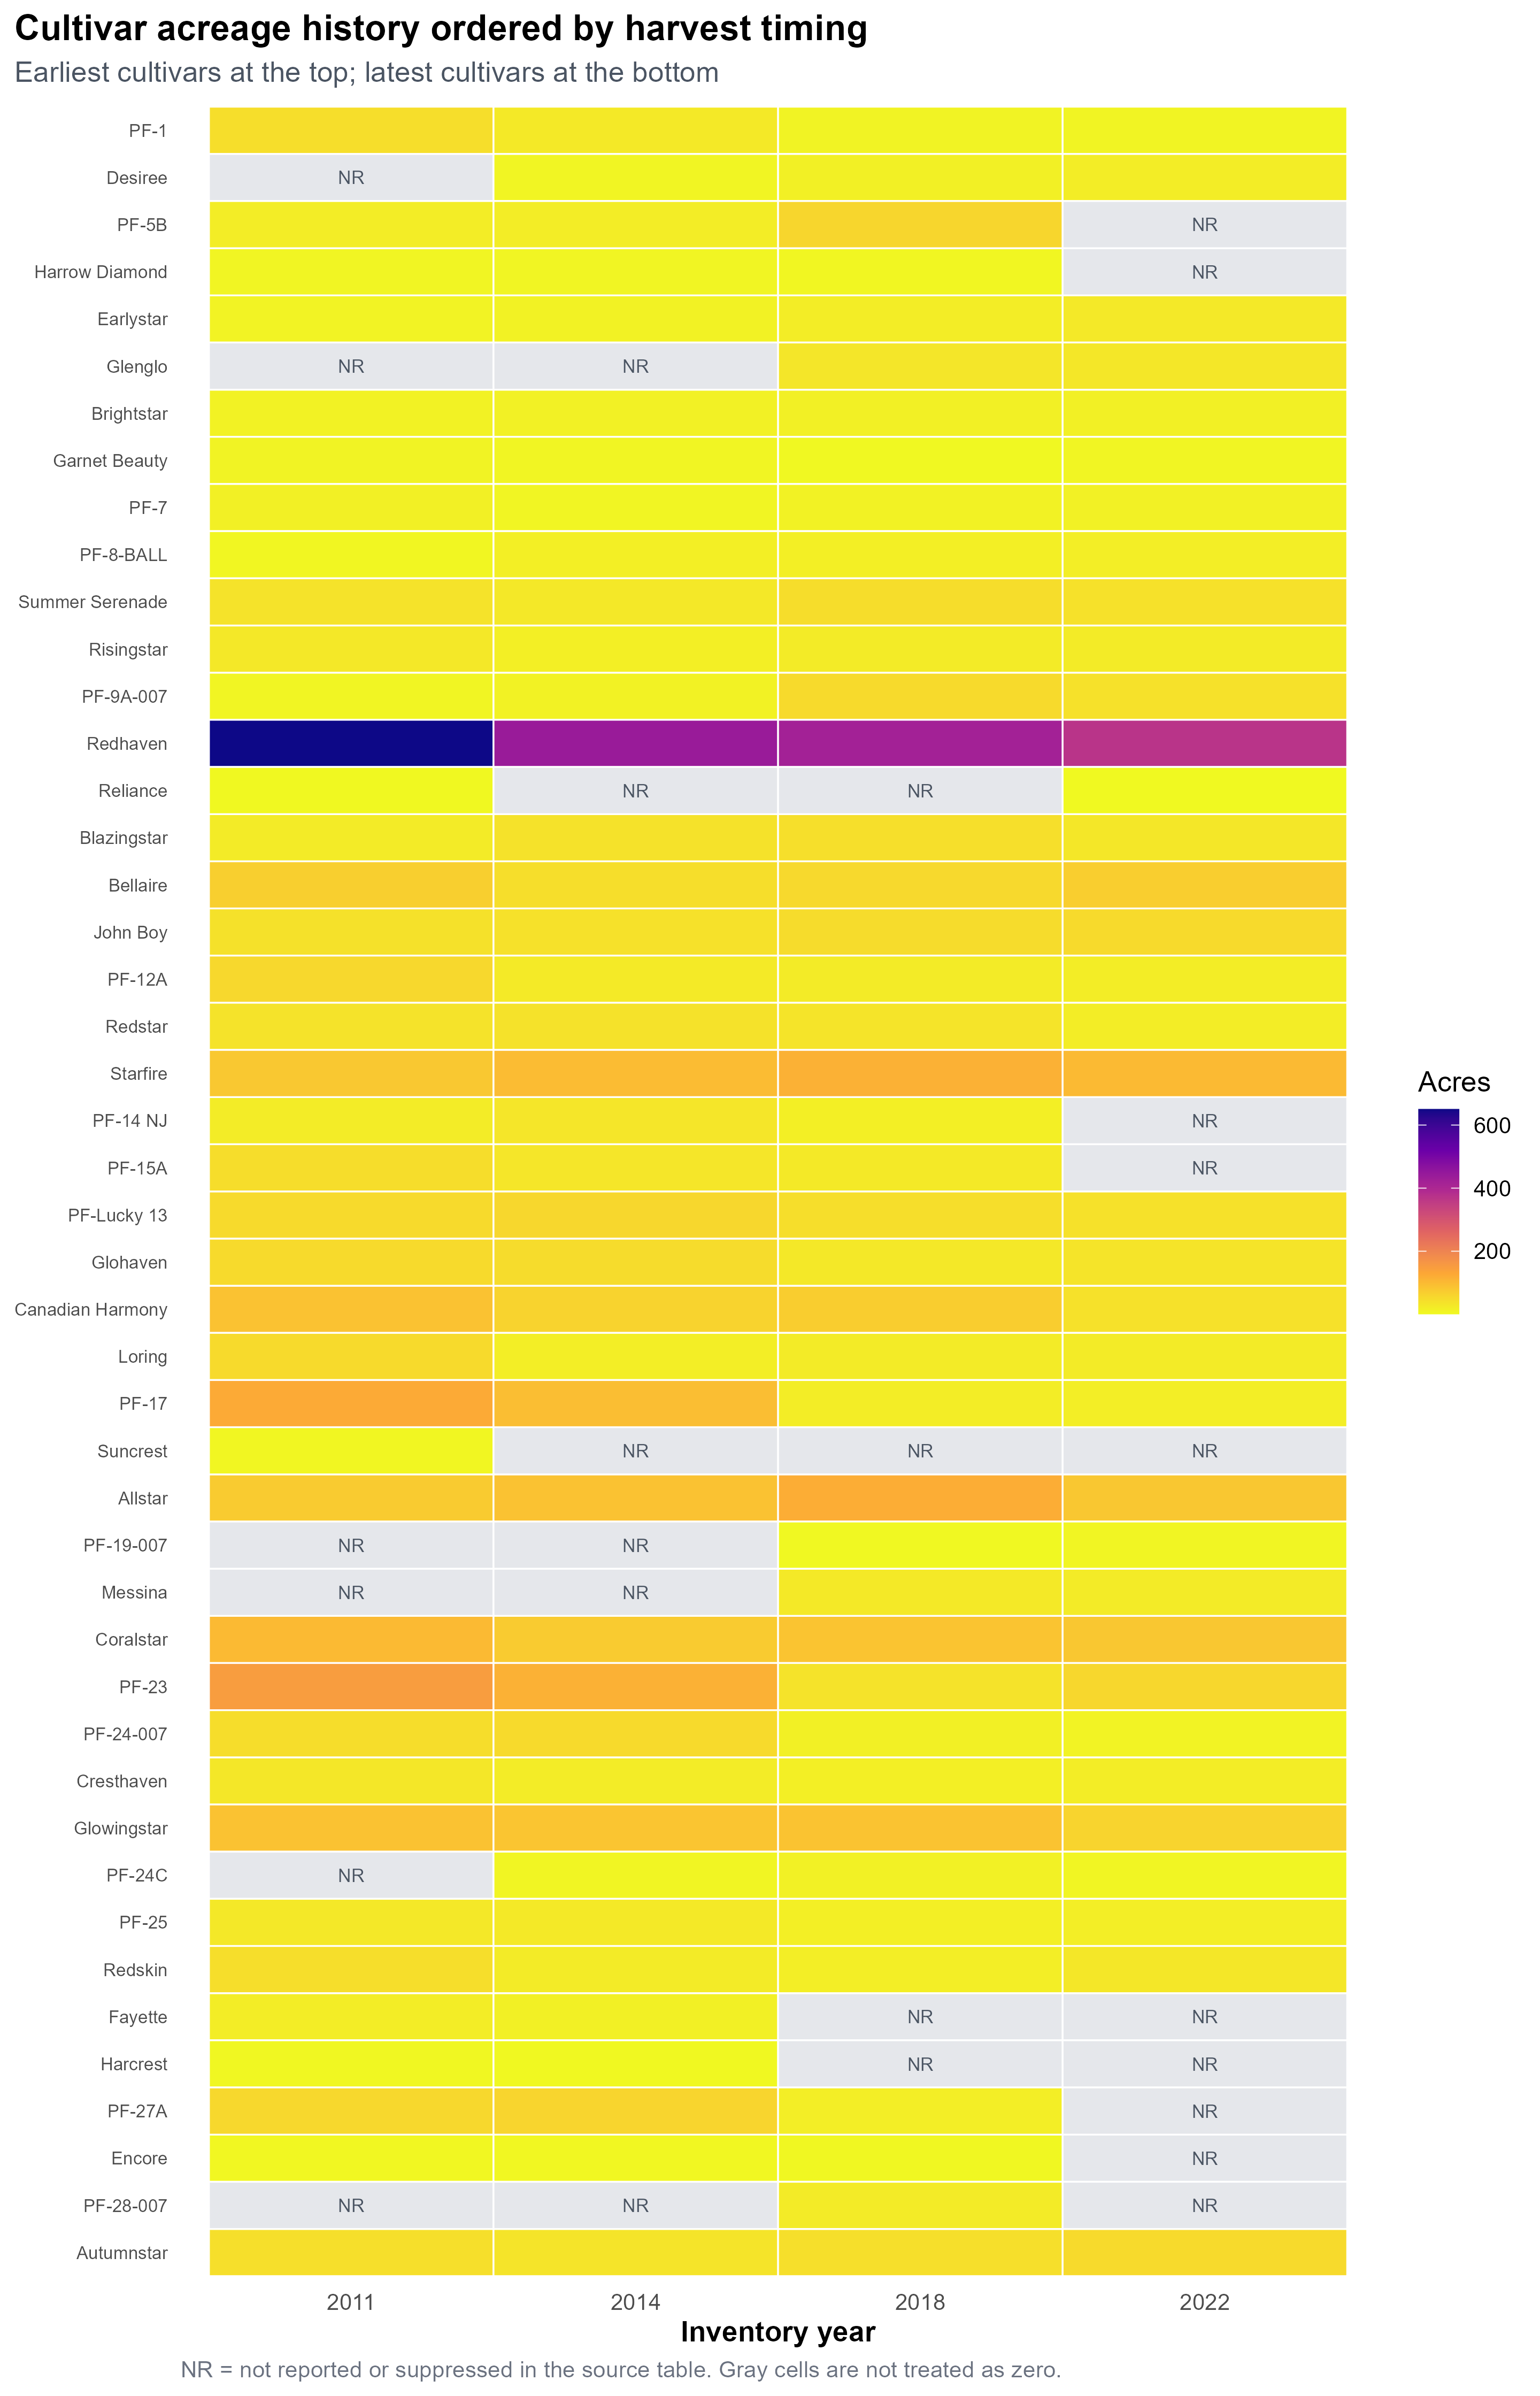
Cultivar acreage history ordered by harvest timing
Cultivar acreage history ordered by harvest timing. Earliest cultivars at the top; latest cultivars at the bottom.
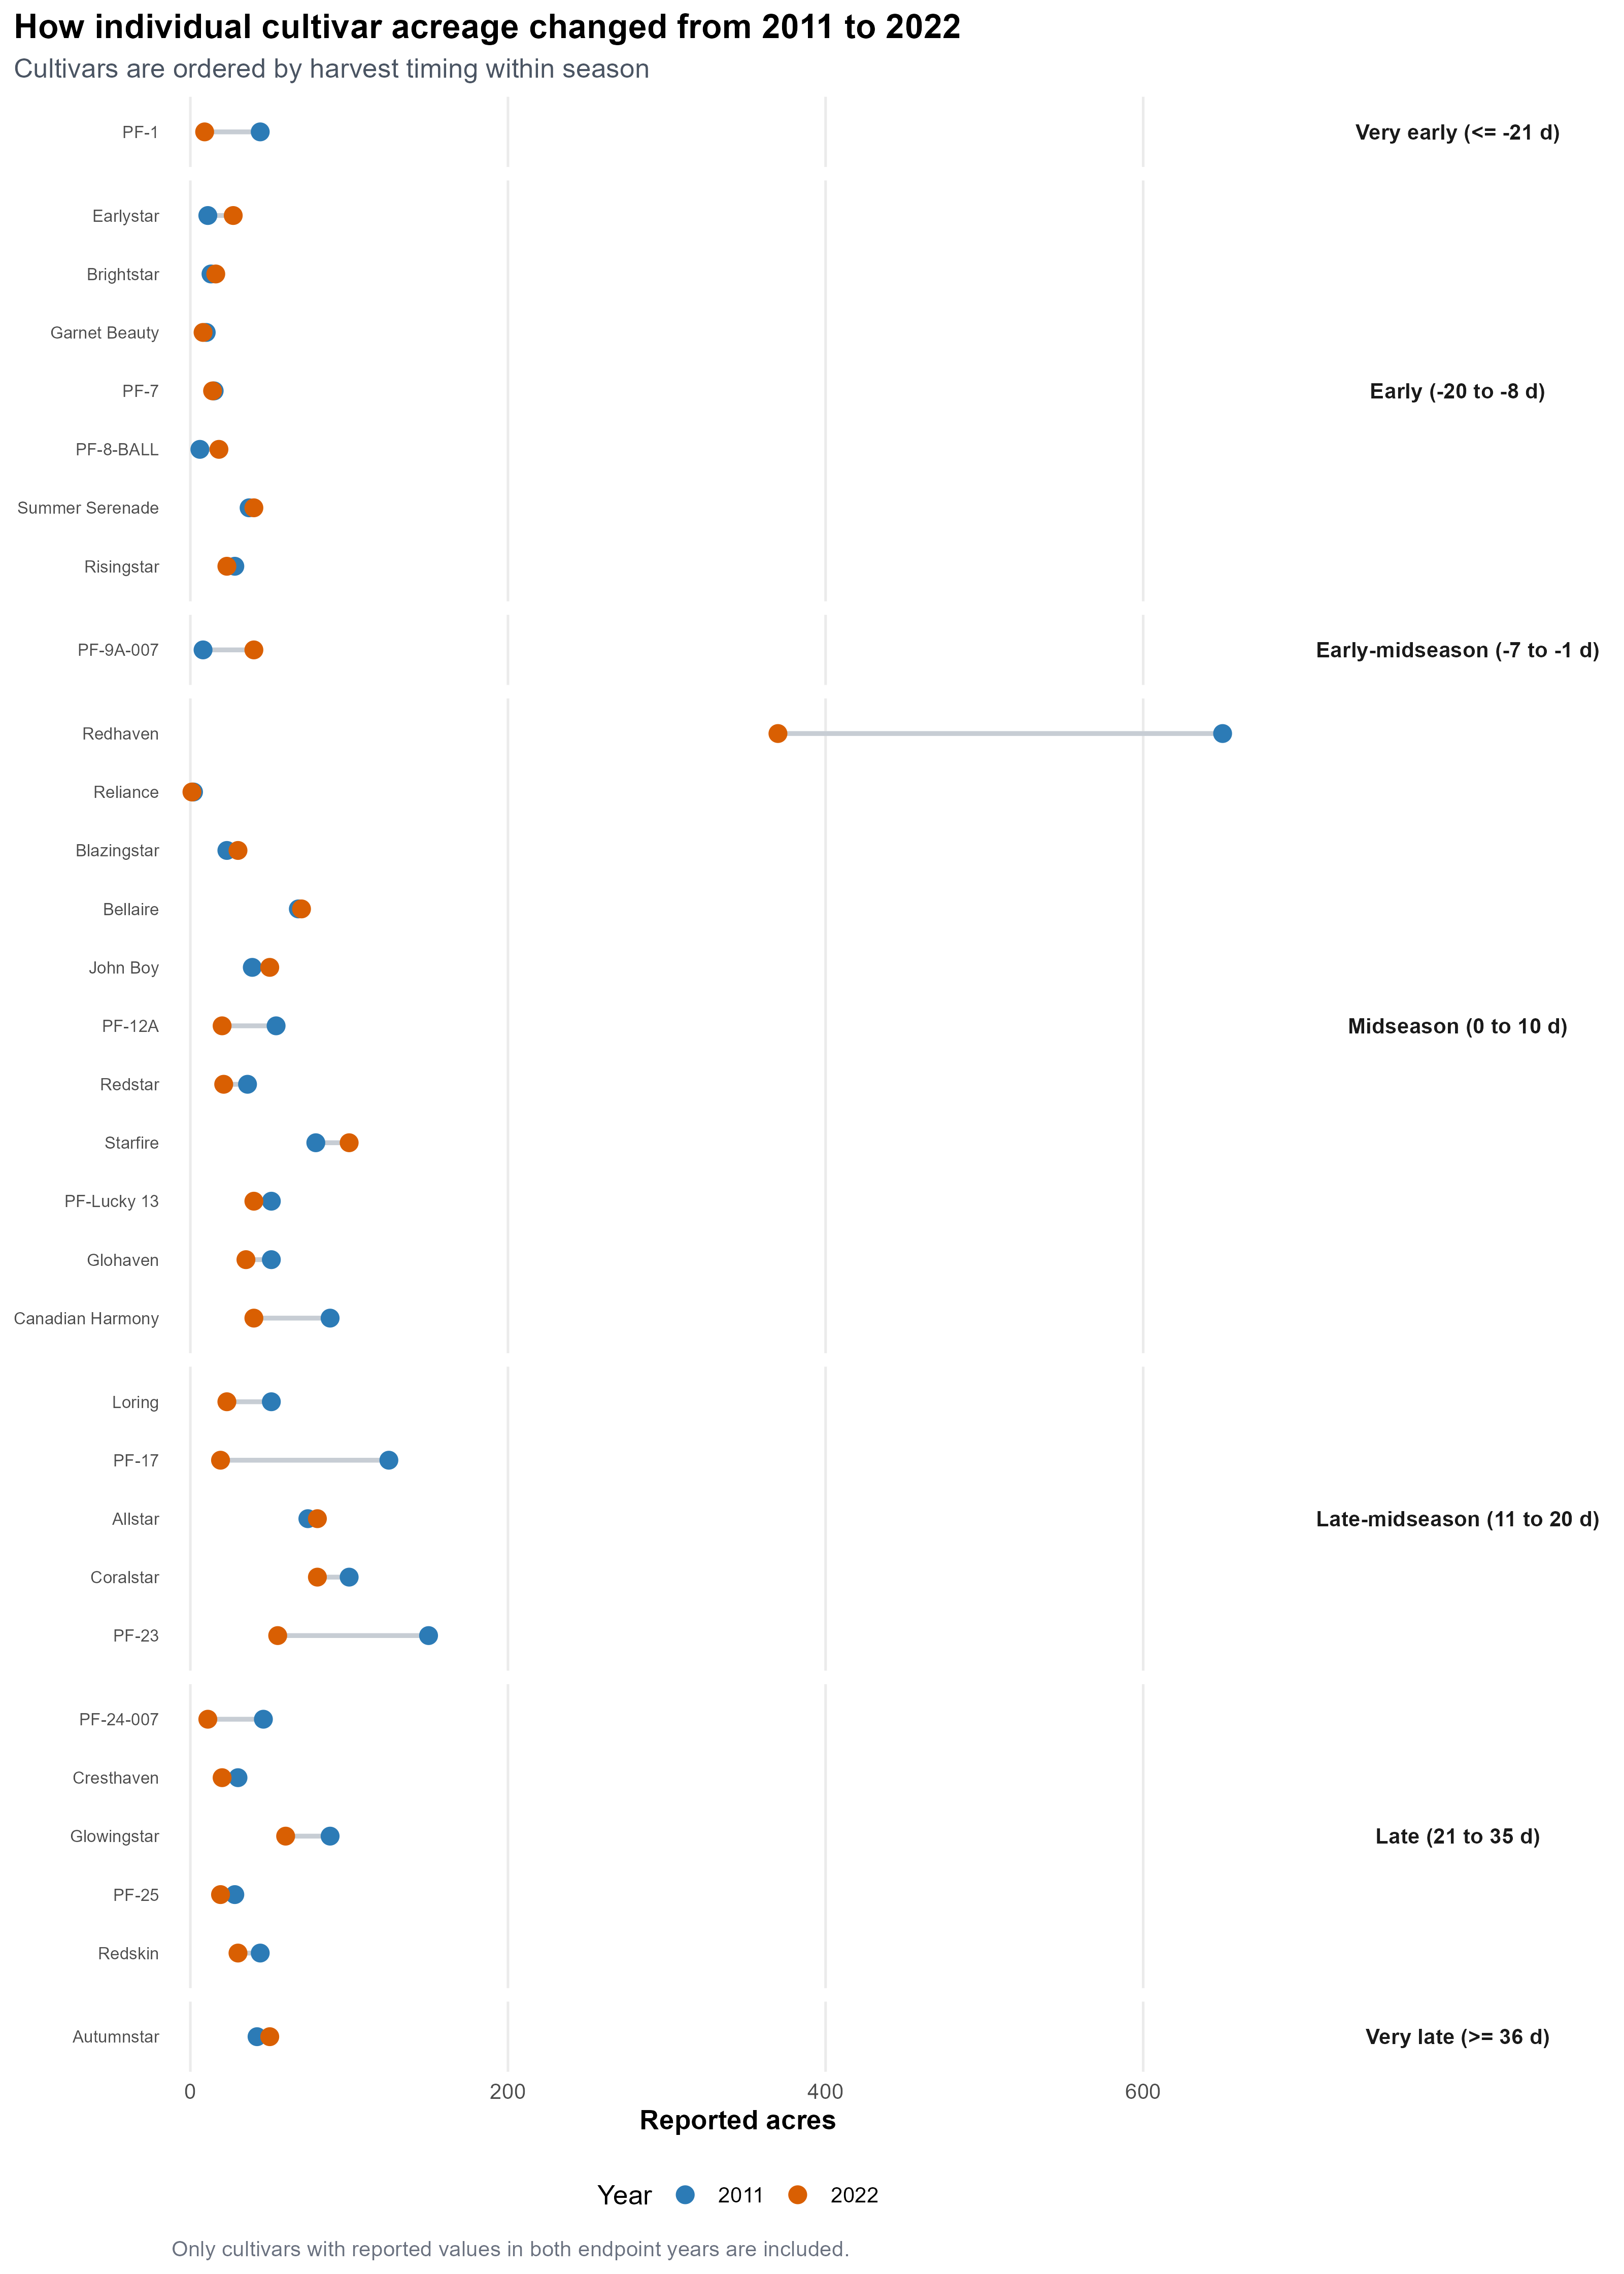
How individual cultivar acreage changed from 2011 to 2022
How individual cultivar acreage changed from 2011 to 2022. Cultivars are ordered by harvest timing within season.
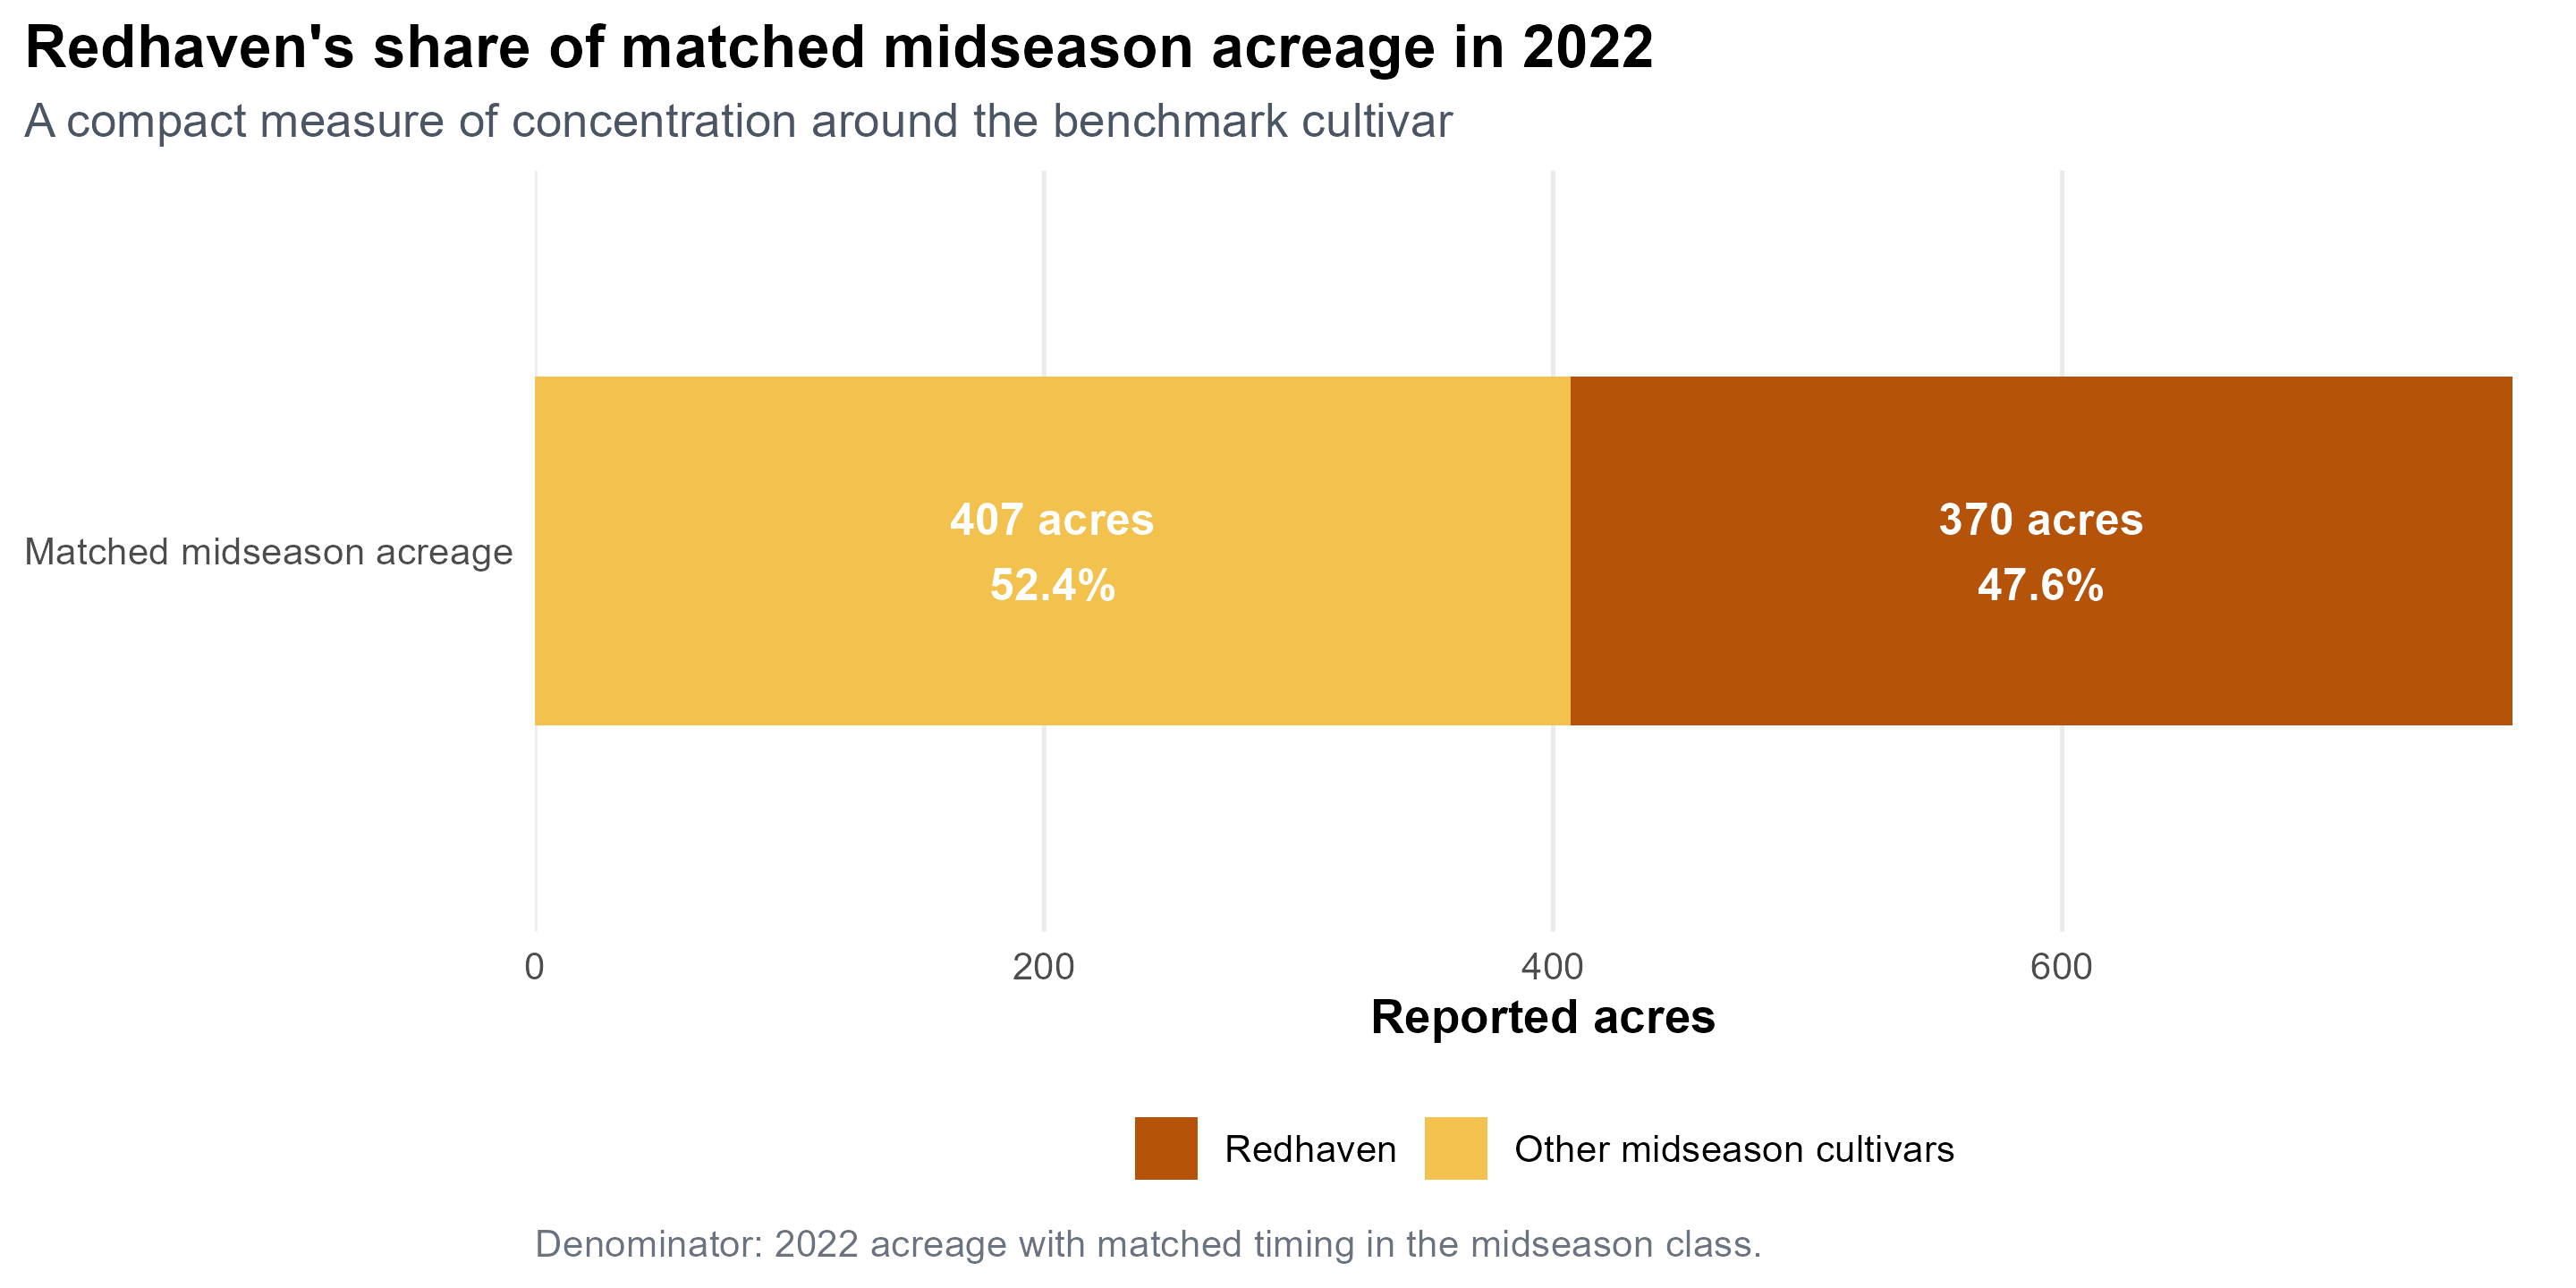
Redhaven's share of matched midseason acreage in 2022
Redhaven's share of matched midseason acreage in 2022. A compact measure of concentration around the benchmark cultivar.
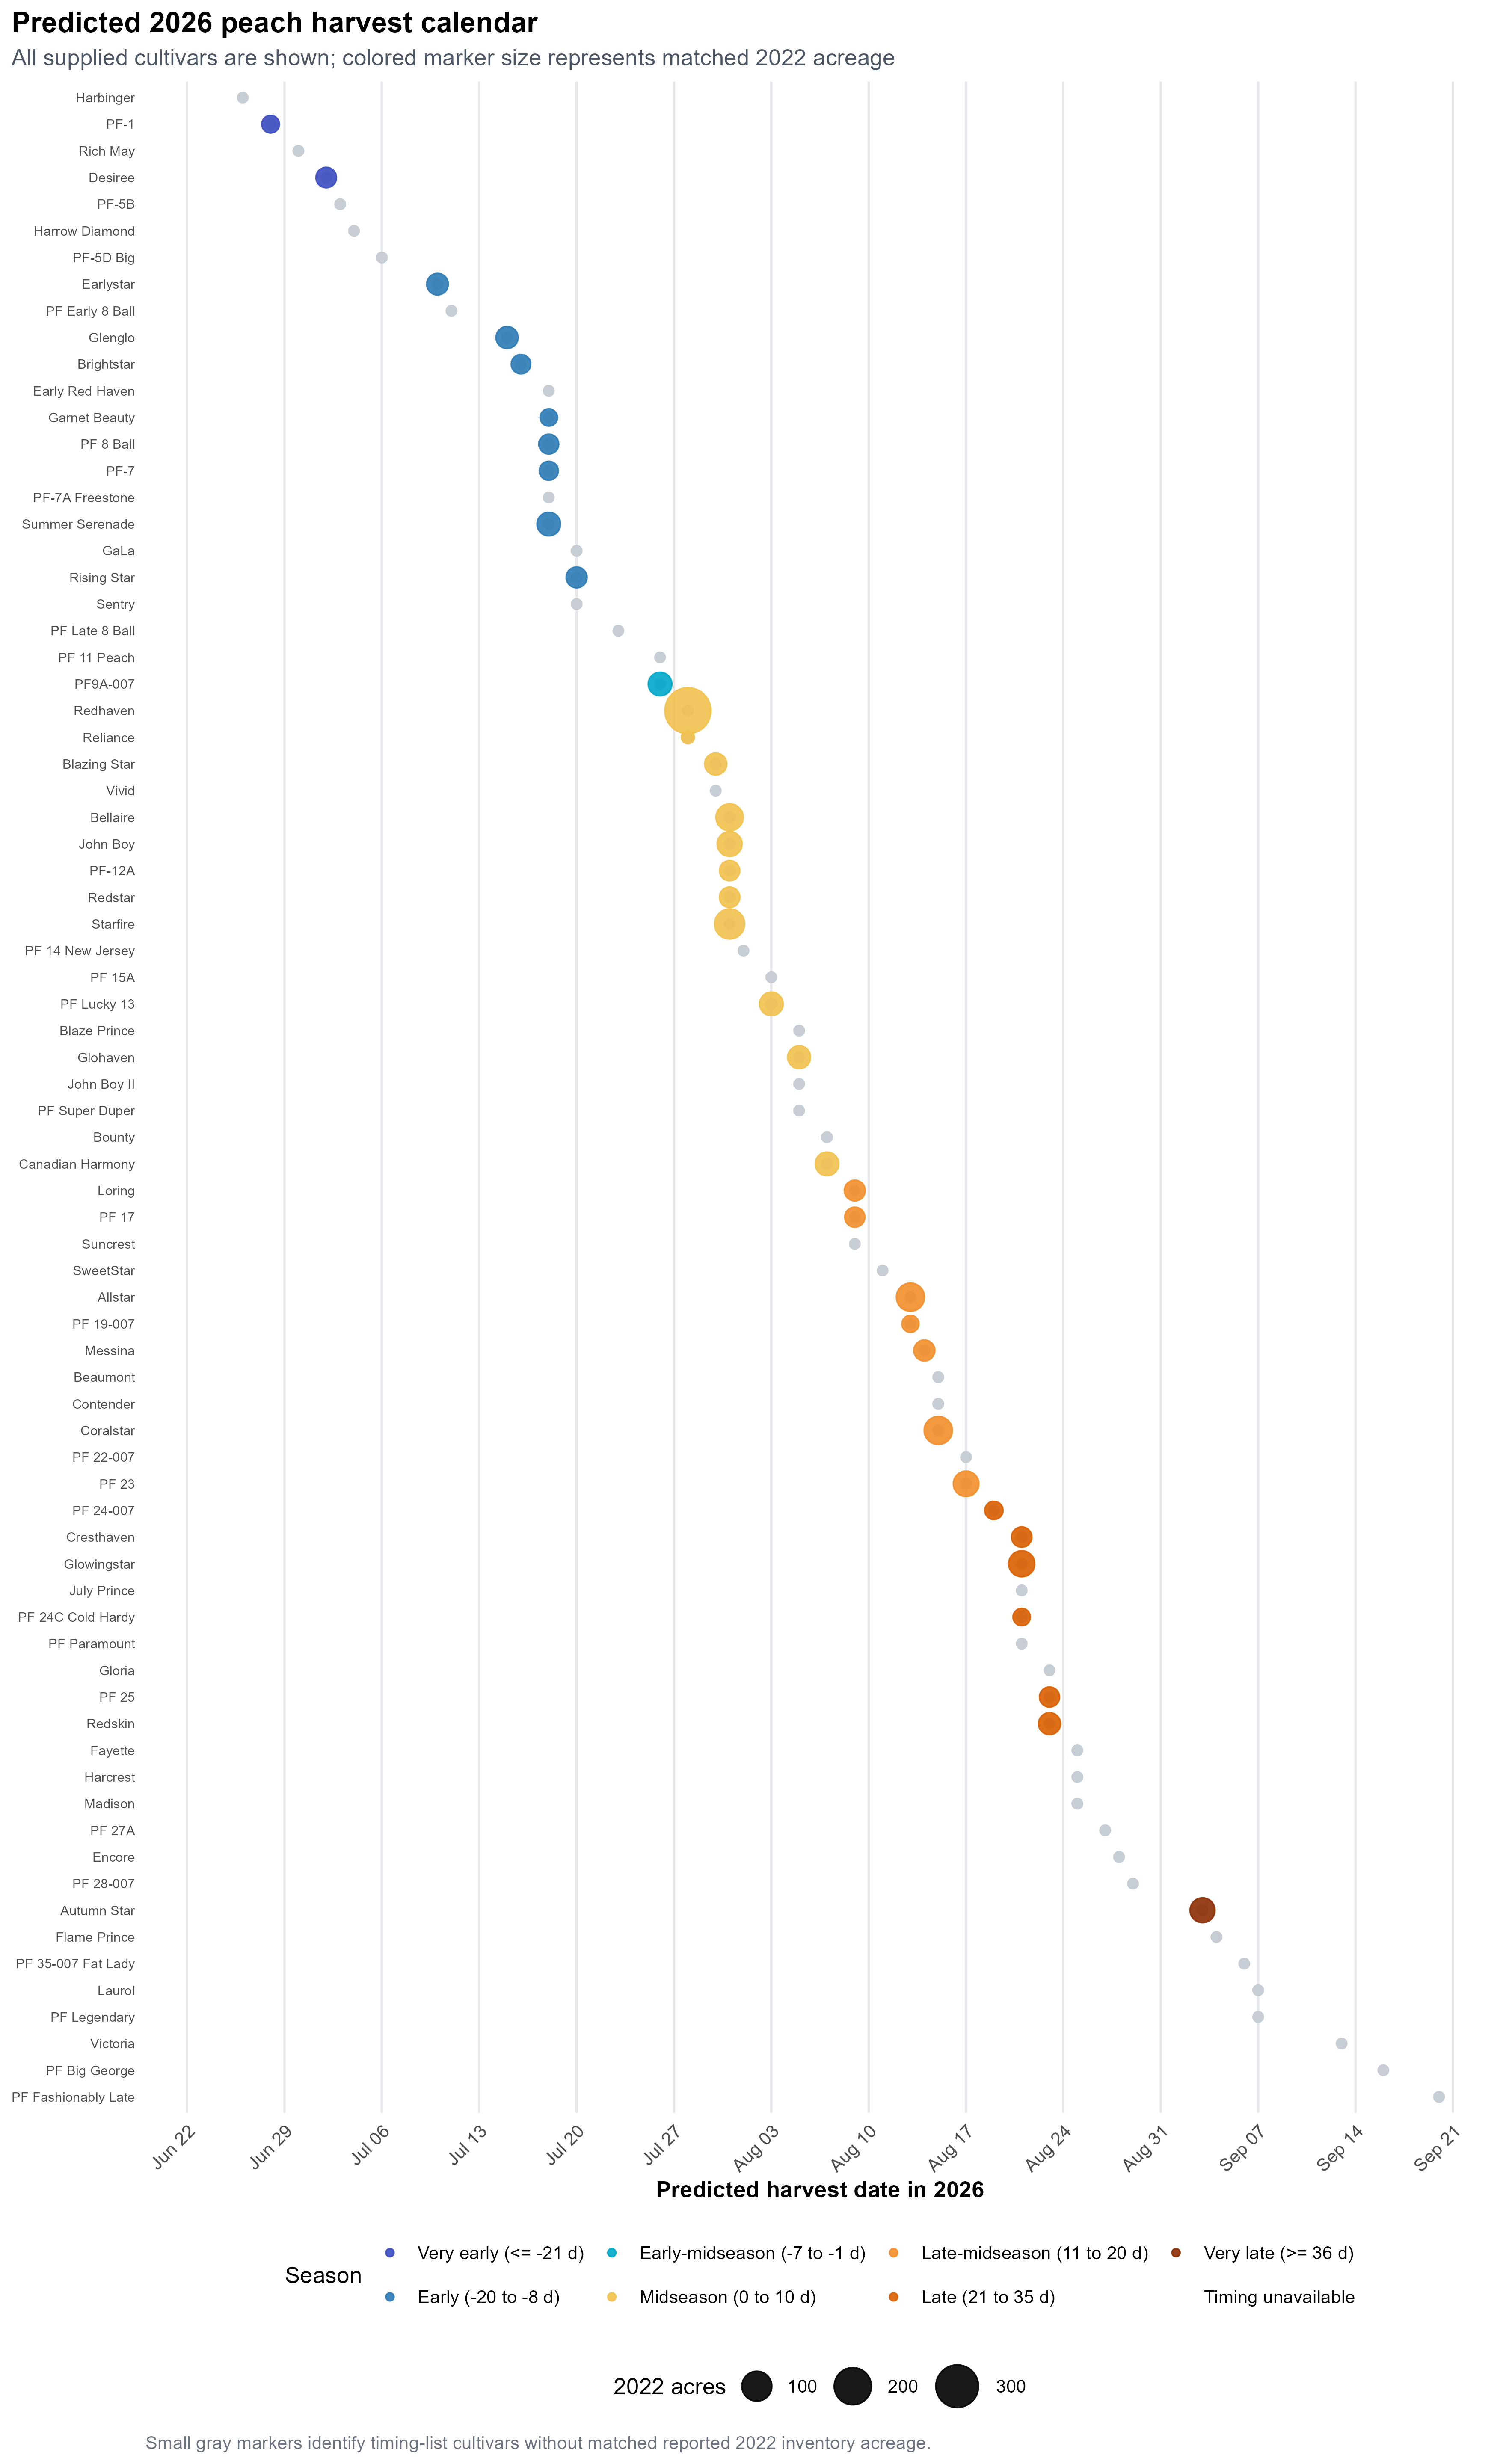
Predicted 2026 peach harvest calendar
Predicted 2026 peach harvest calendar. All supplied cultivars are shown; colored marker size represents matched 2022 acreage.
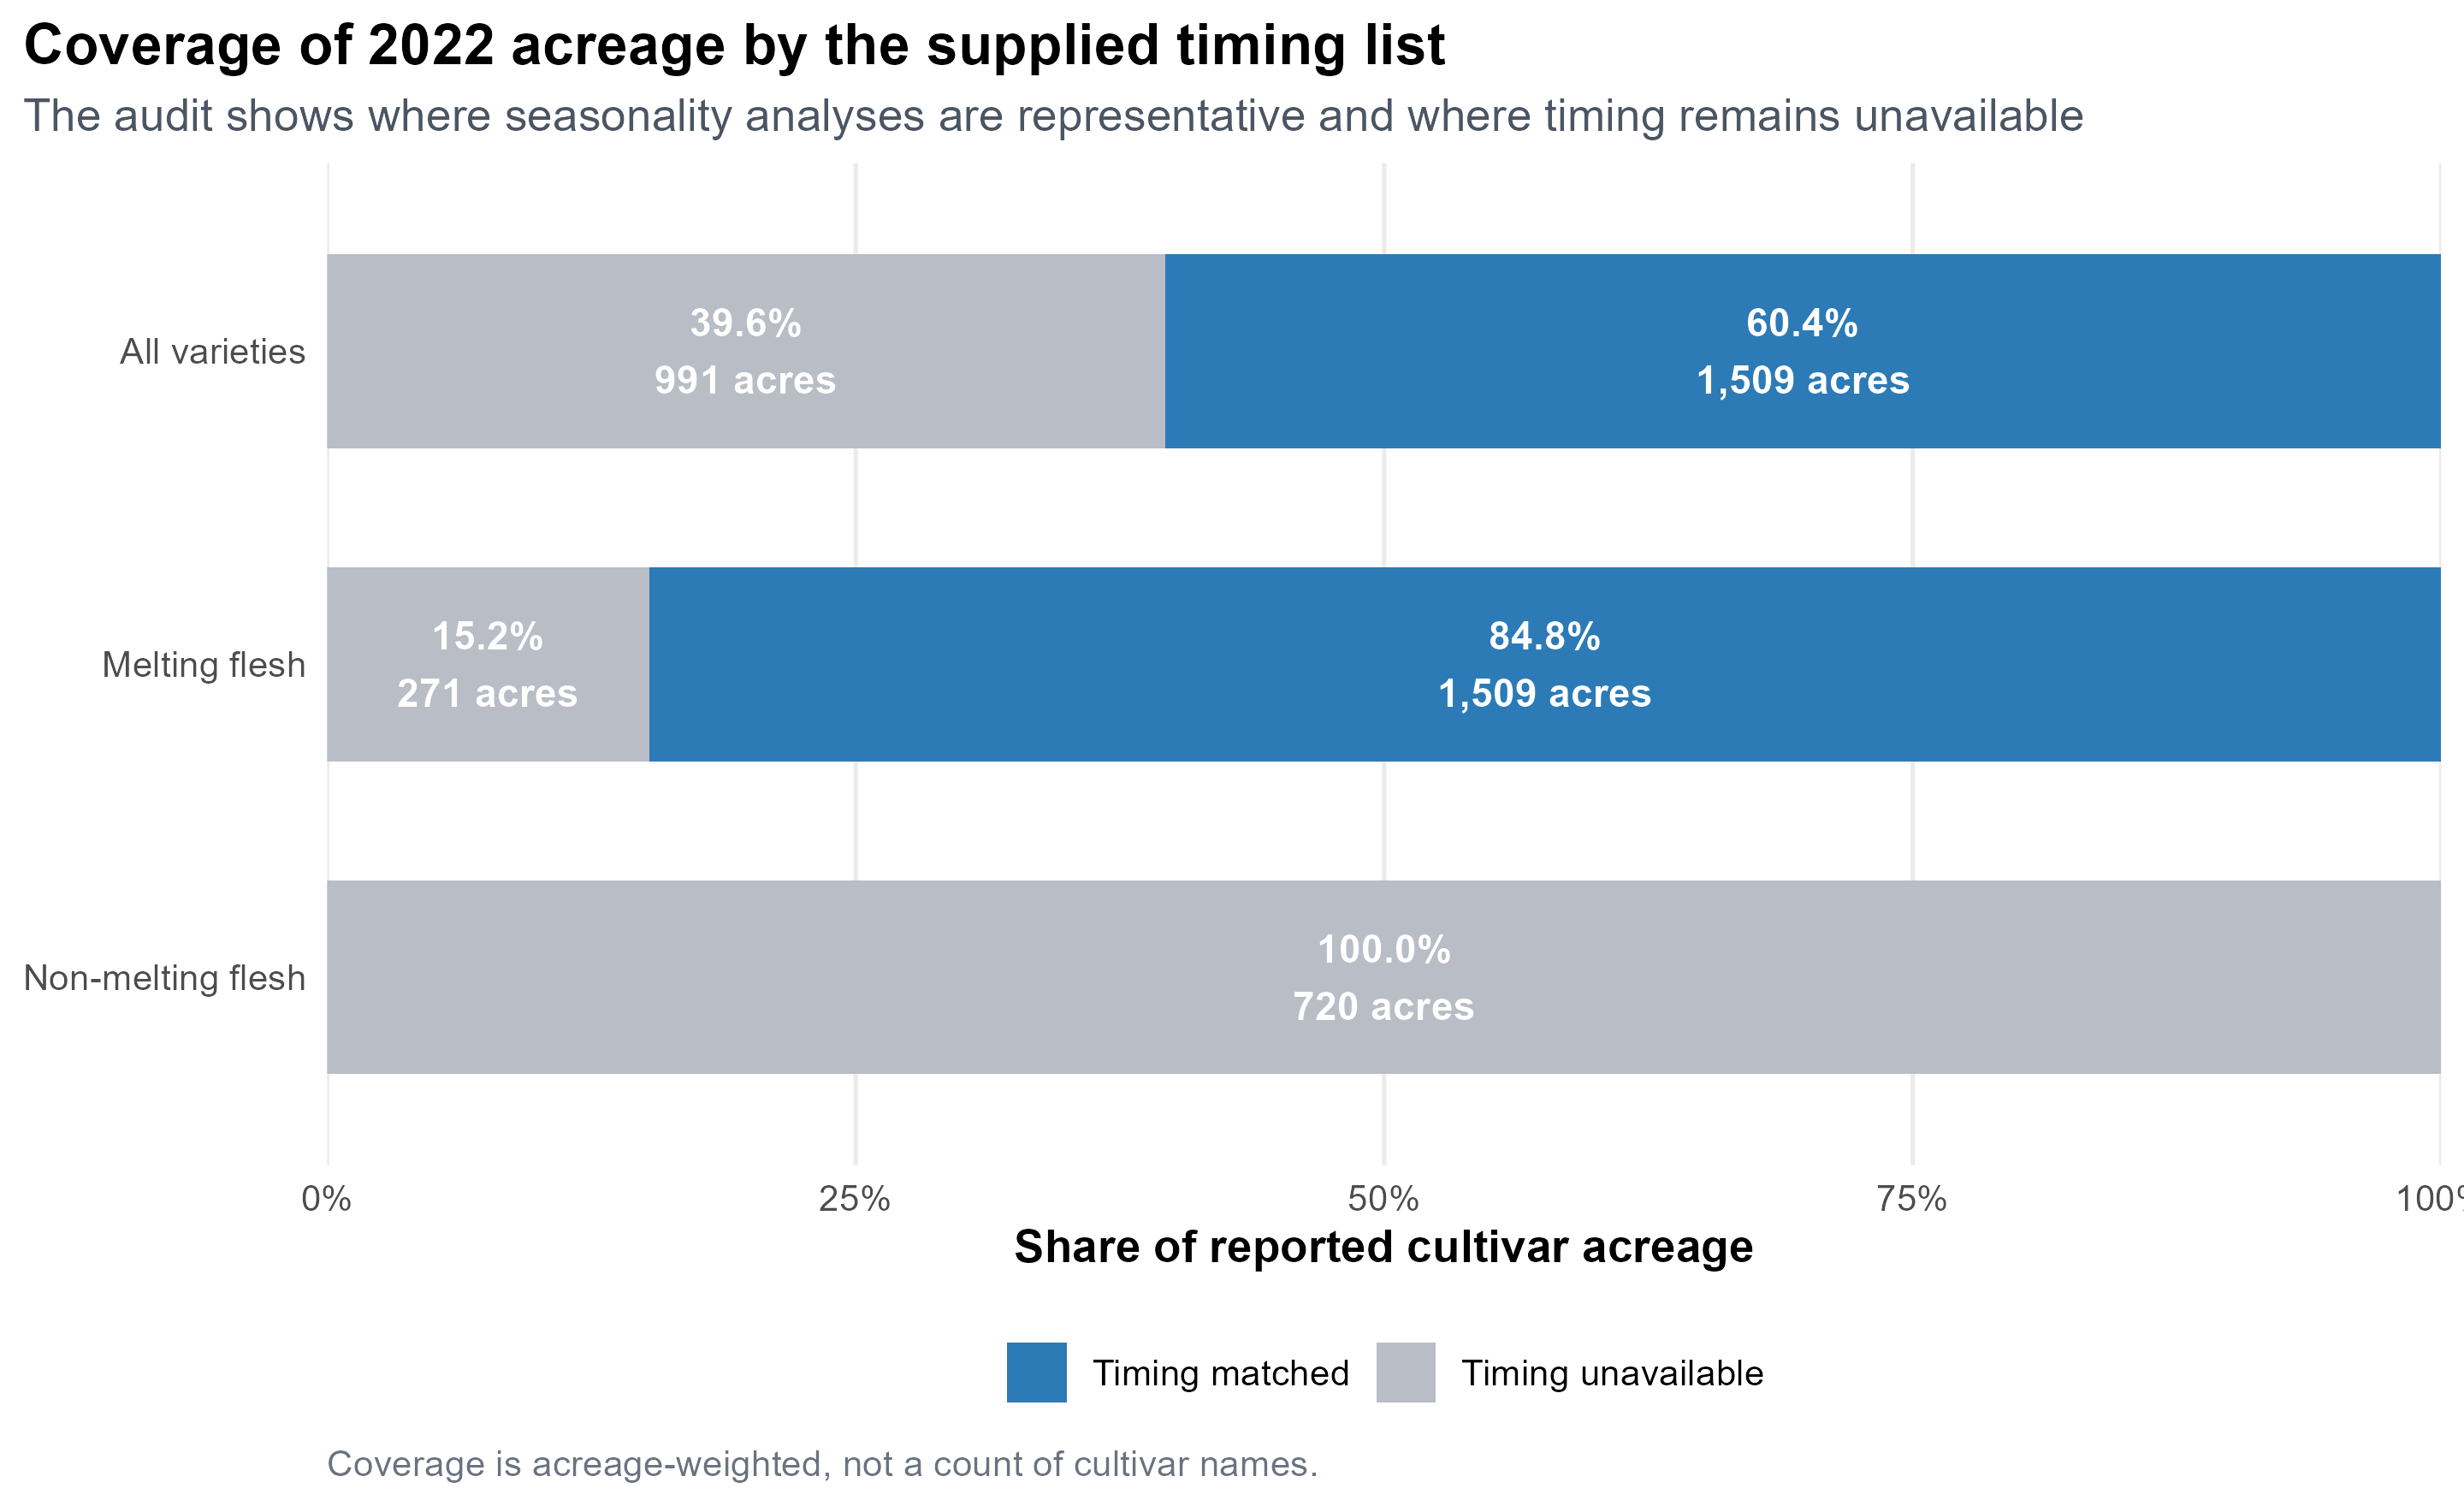
Coverage of 2022 acreage by the supplied timing list
Coverage of 2022 acreage by the supplied timing list. Shows where seasonality analyses are representative and where timing remains unavailable.
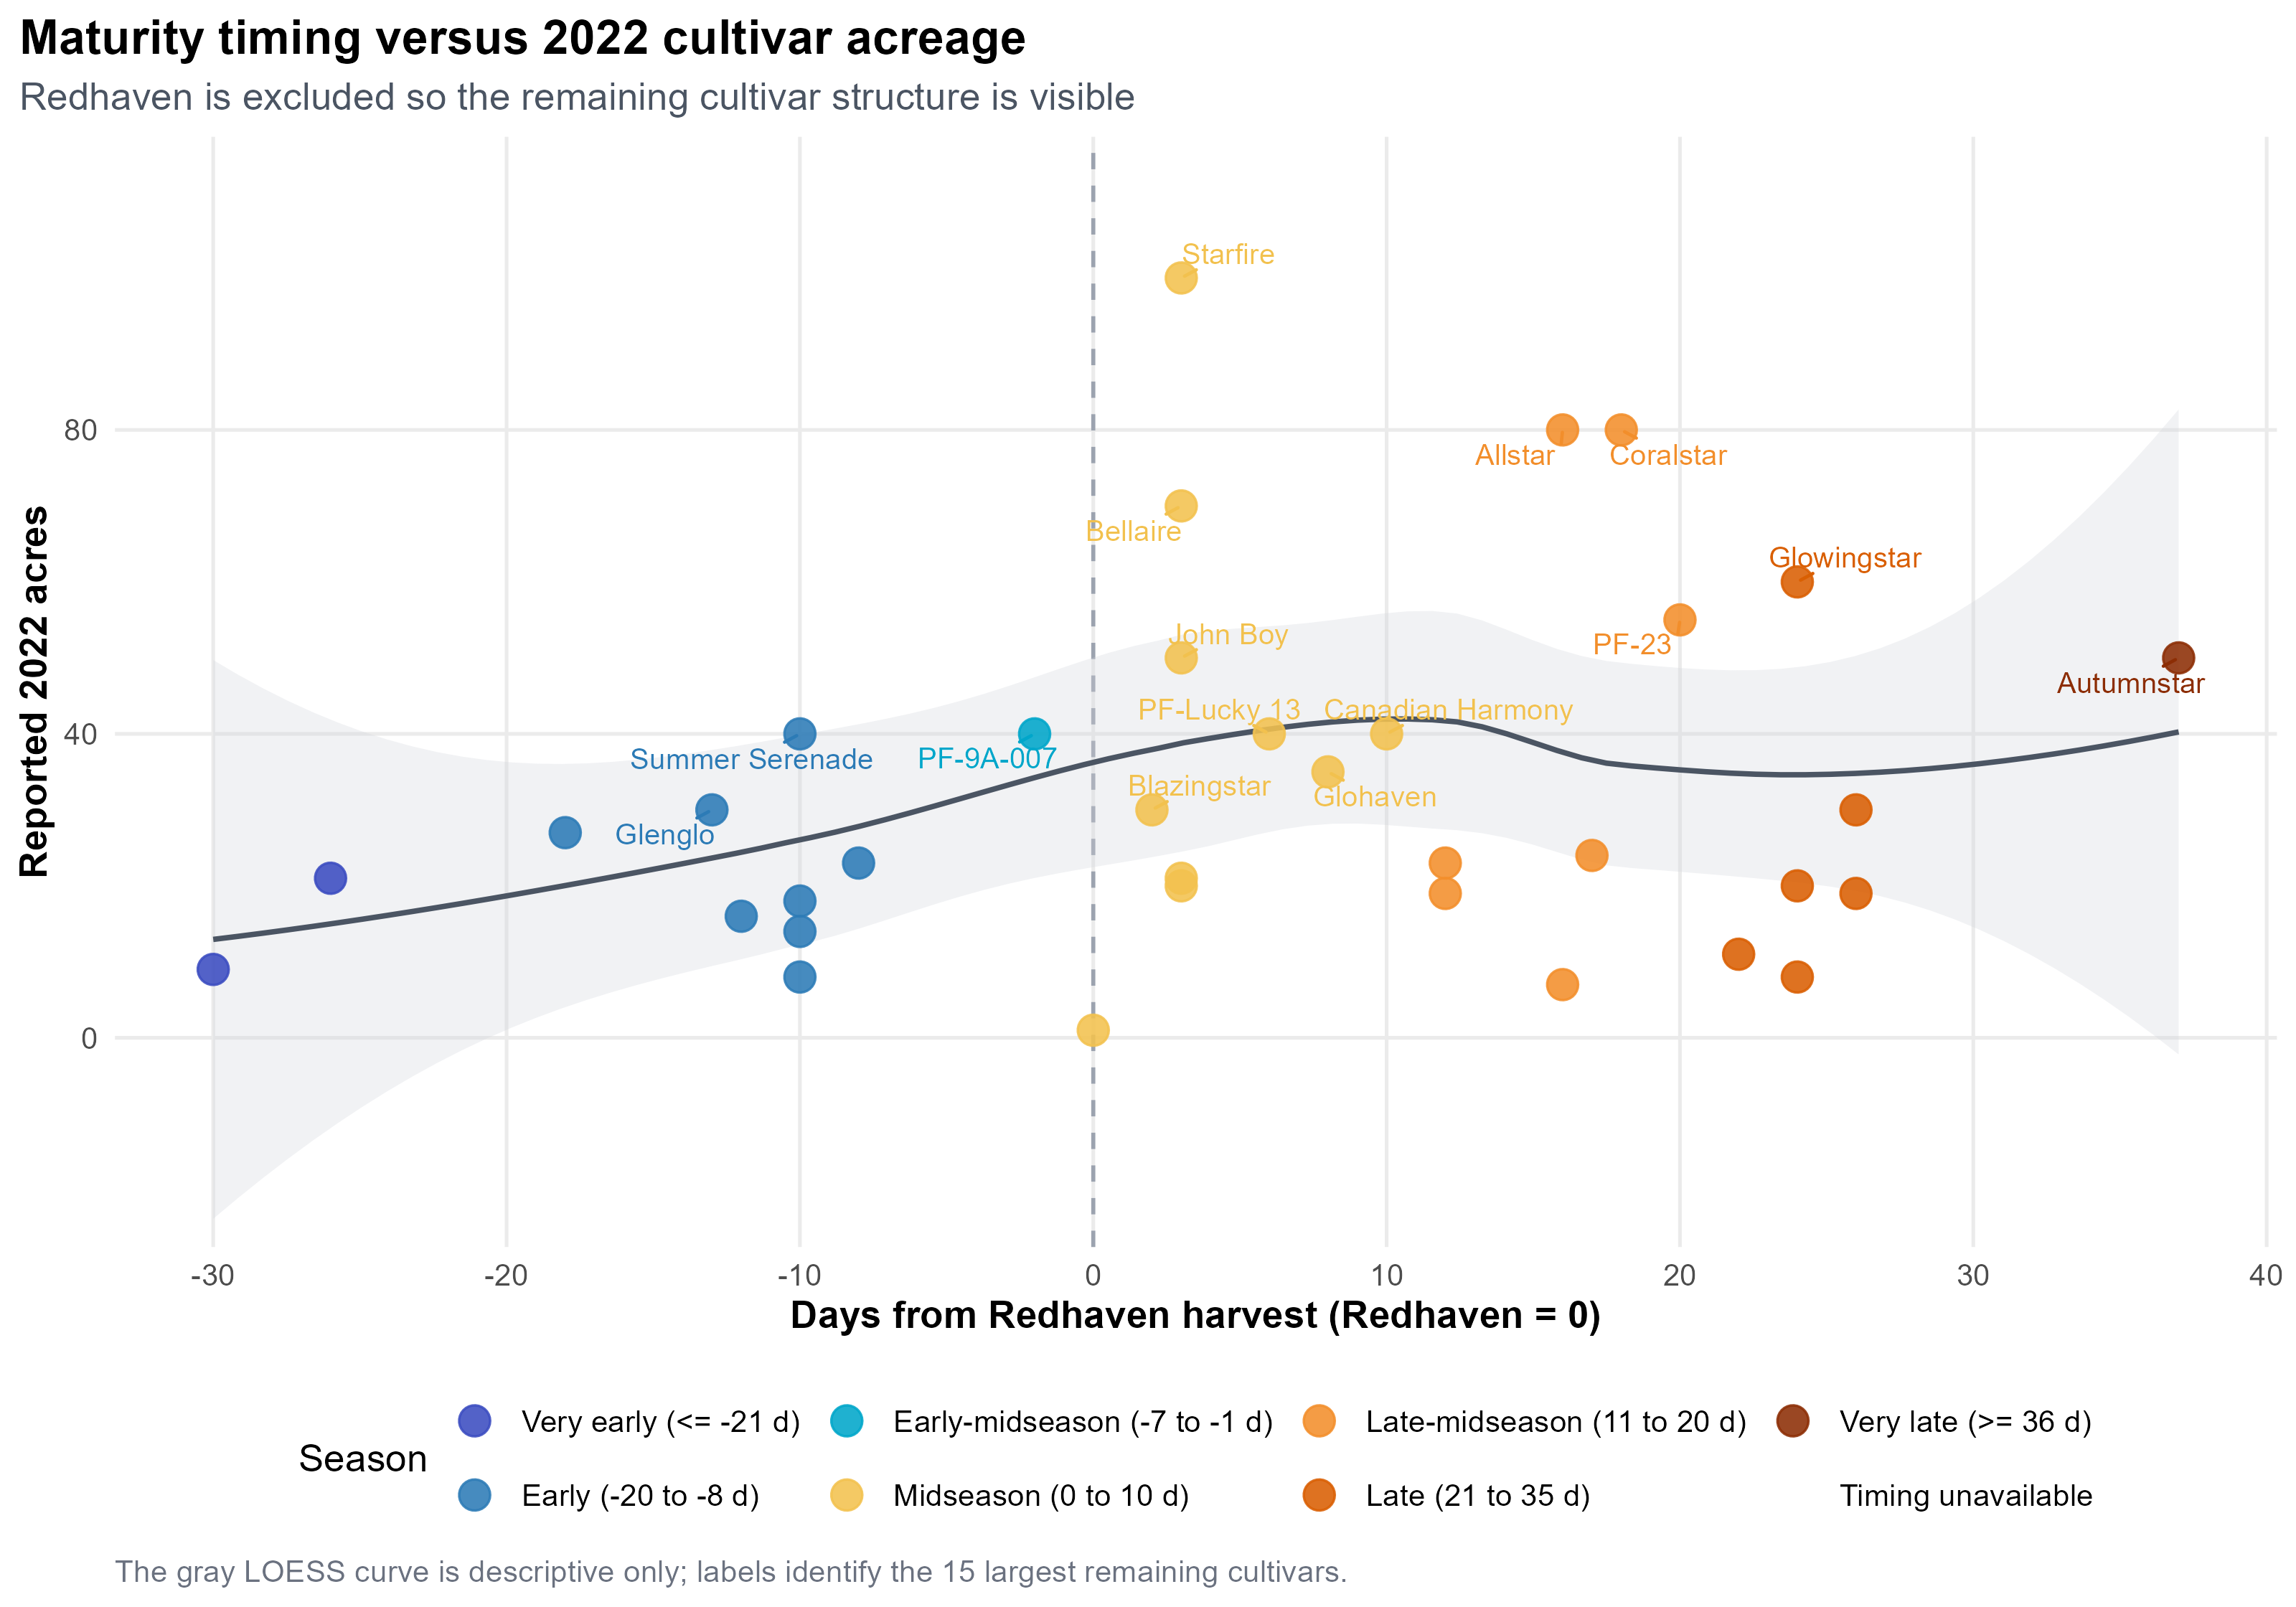
Maturity timing versus 2022 acreage outside Redhaven
Maturity timing versus 2022 acreage outside Redhaven. Redhaven is excluded so the remaining cultivar structure is visible.
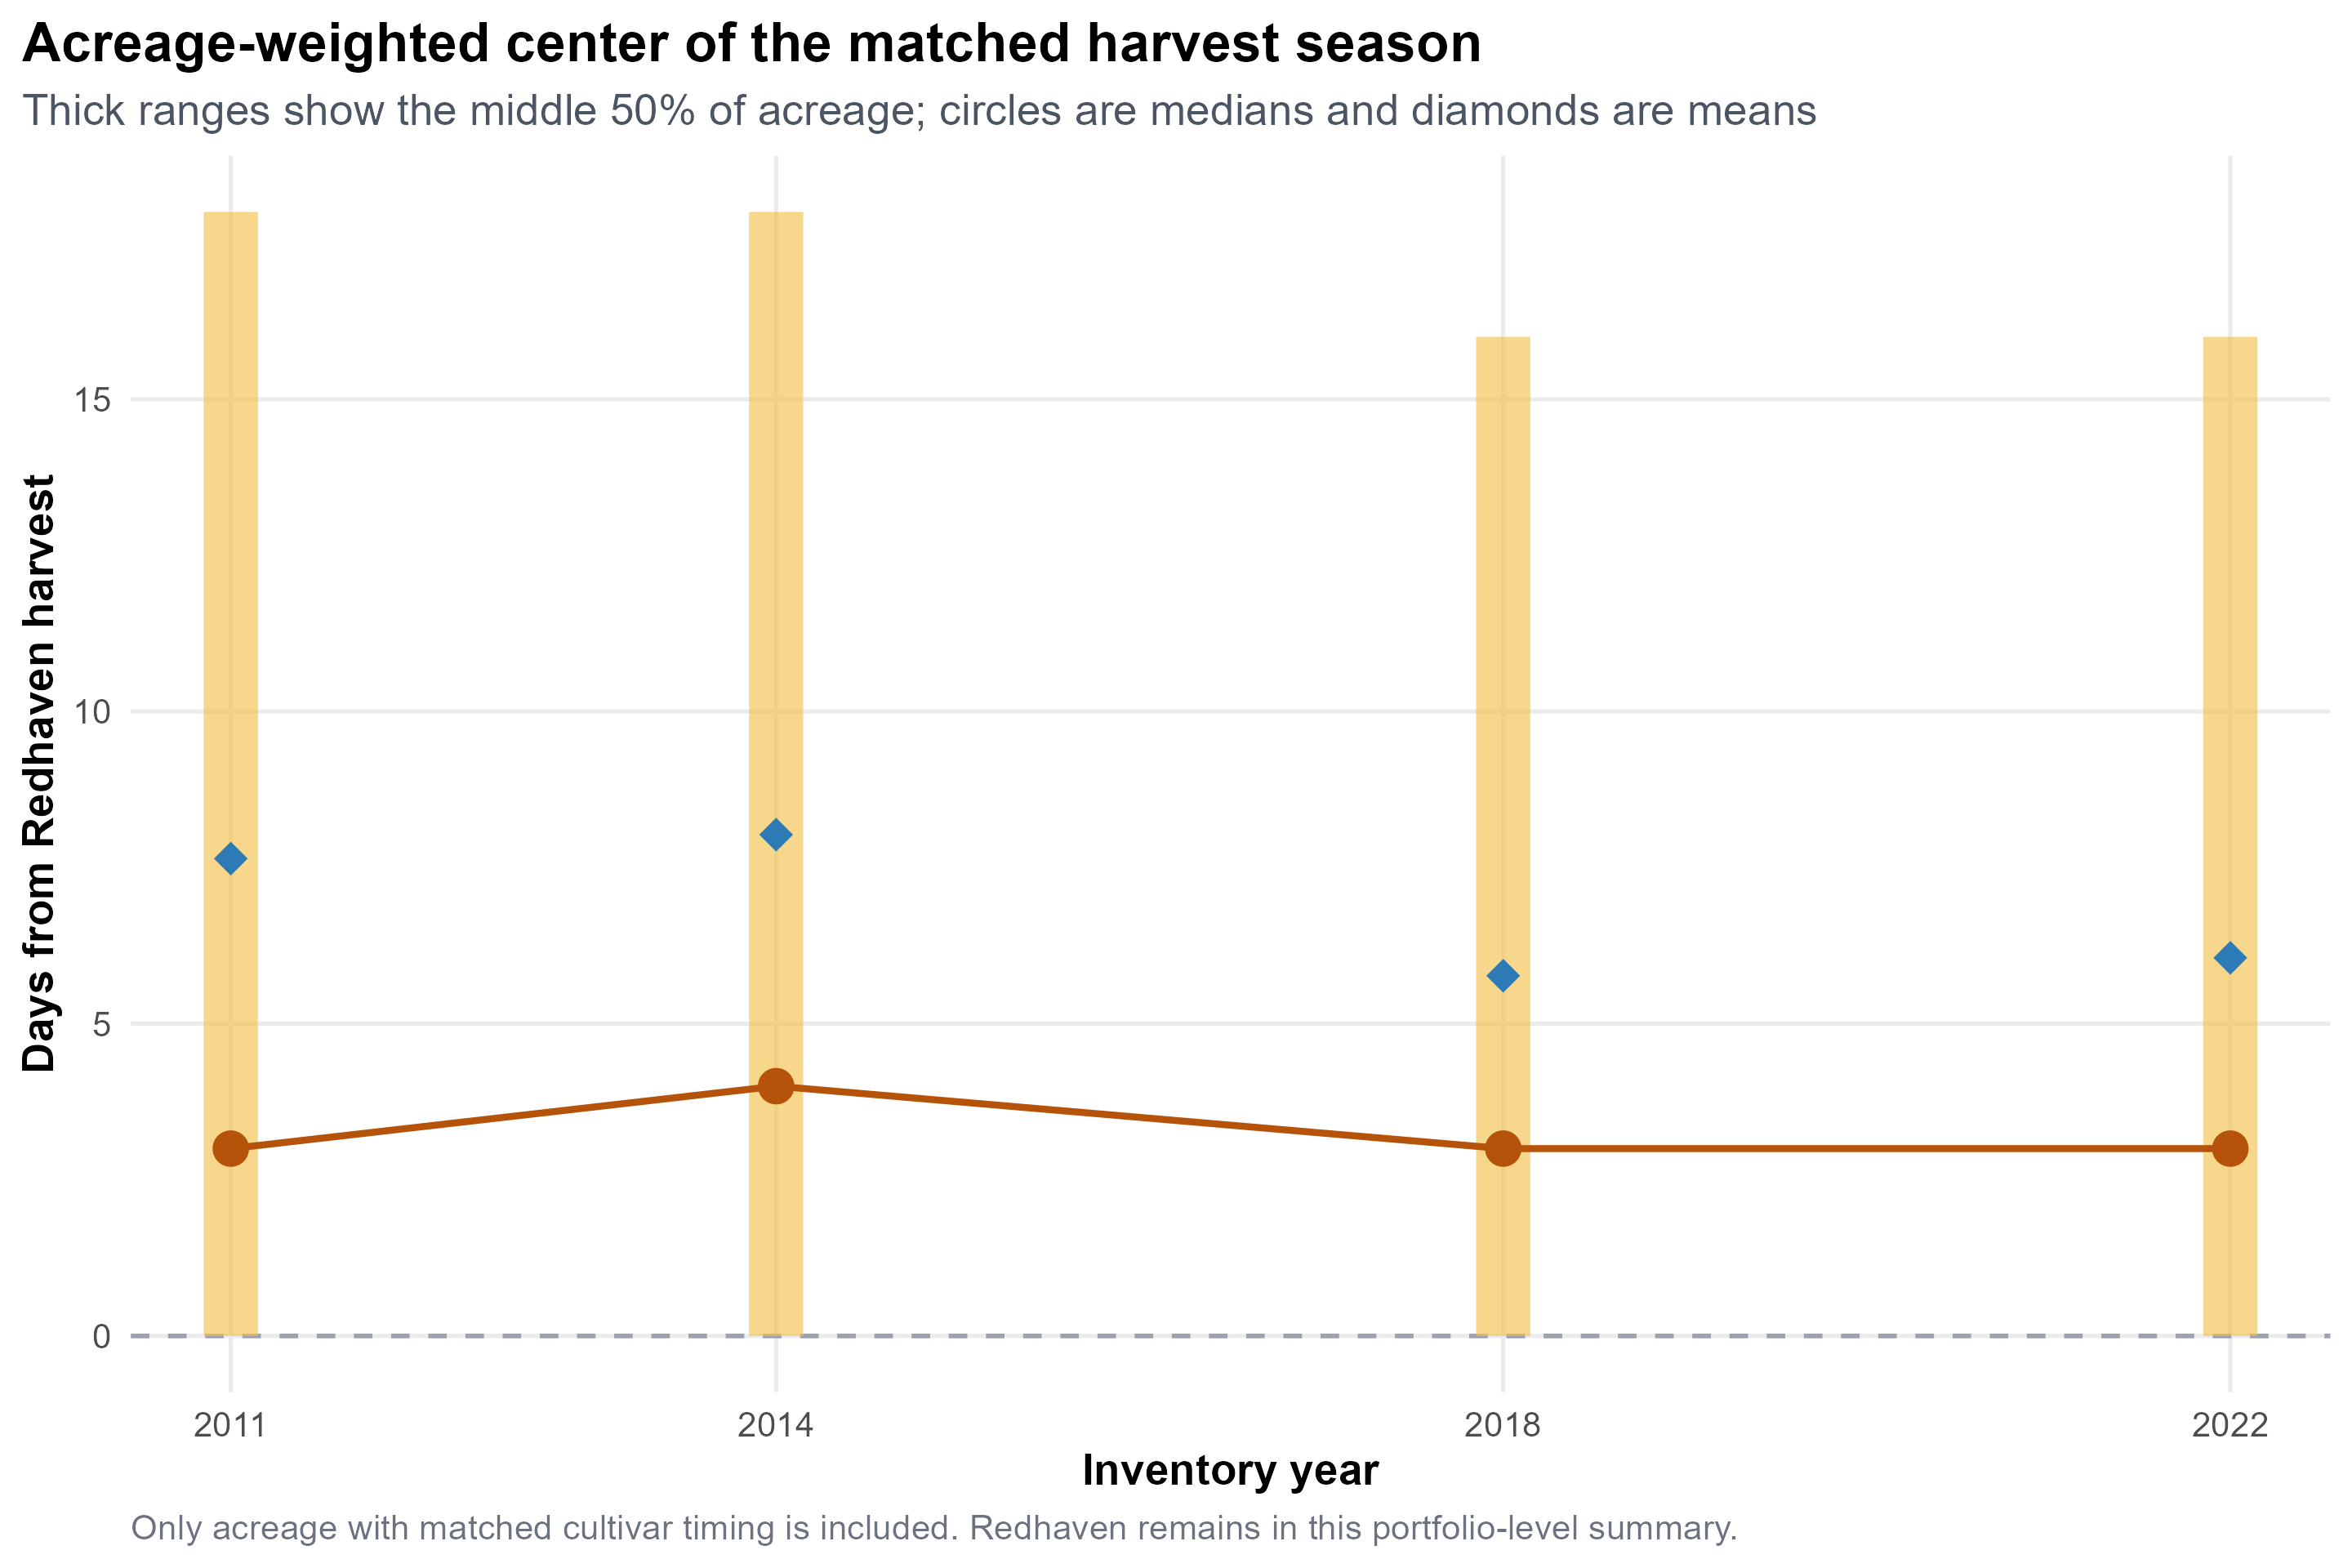
Acreage-weighted timing center by inventory year
Acreage-weighted timing center by inventory year. Thick ranges show the middle 50% of acreage; circles are medians and diamonds are means.
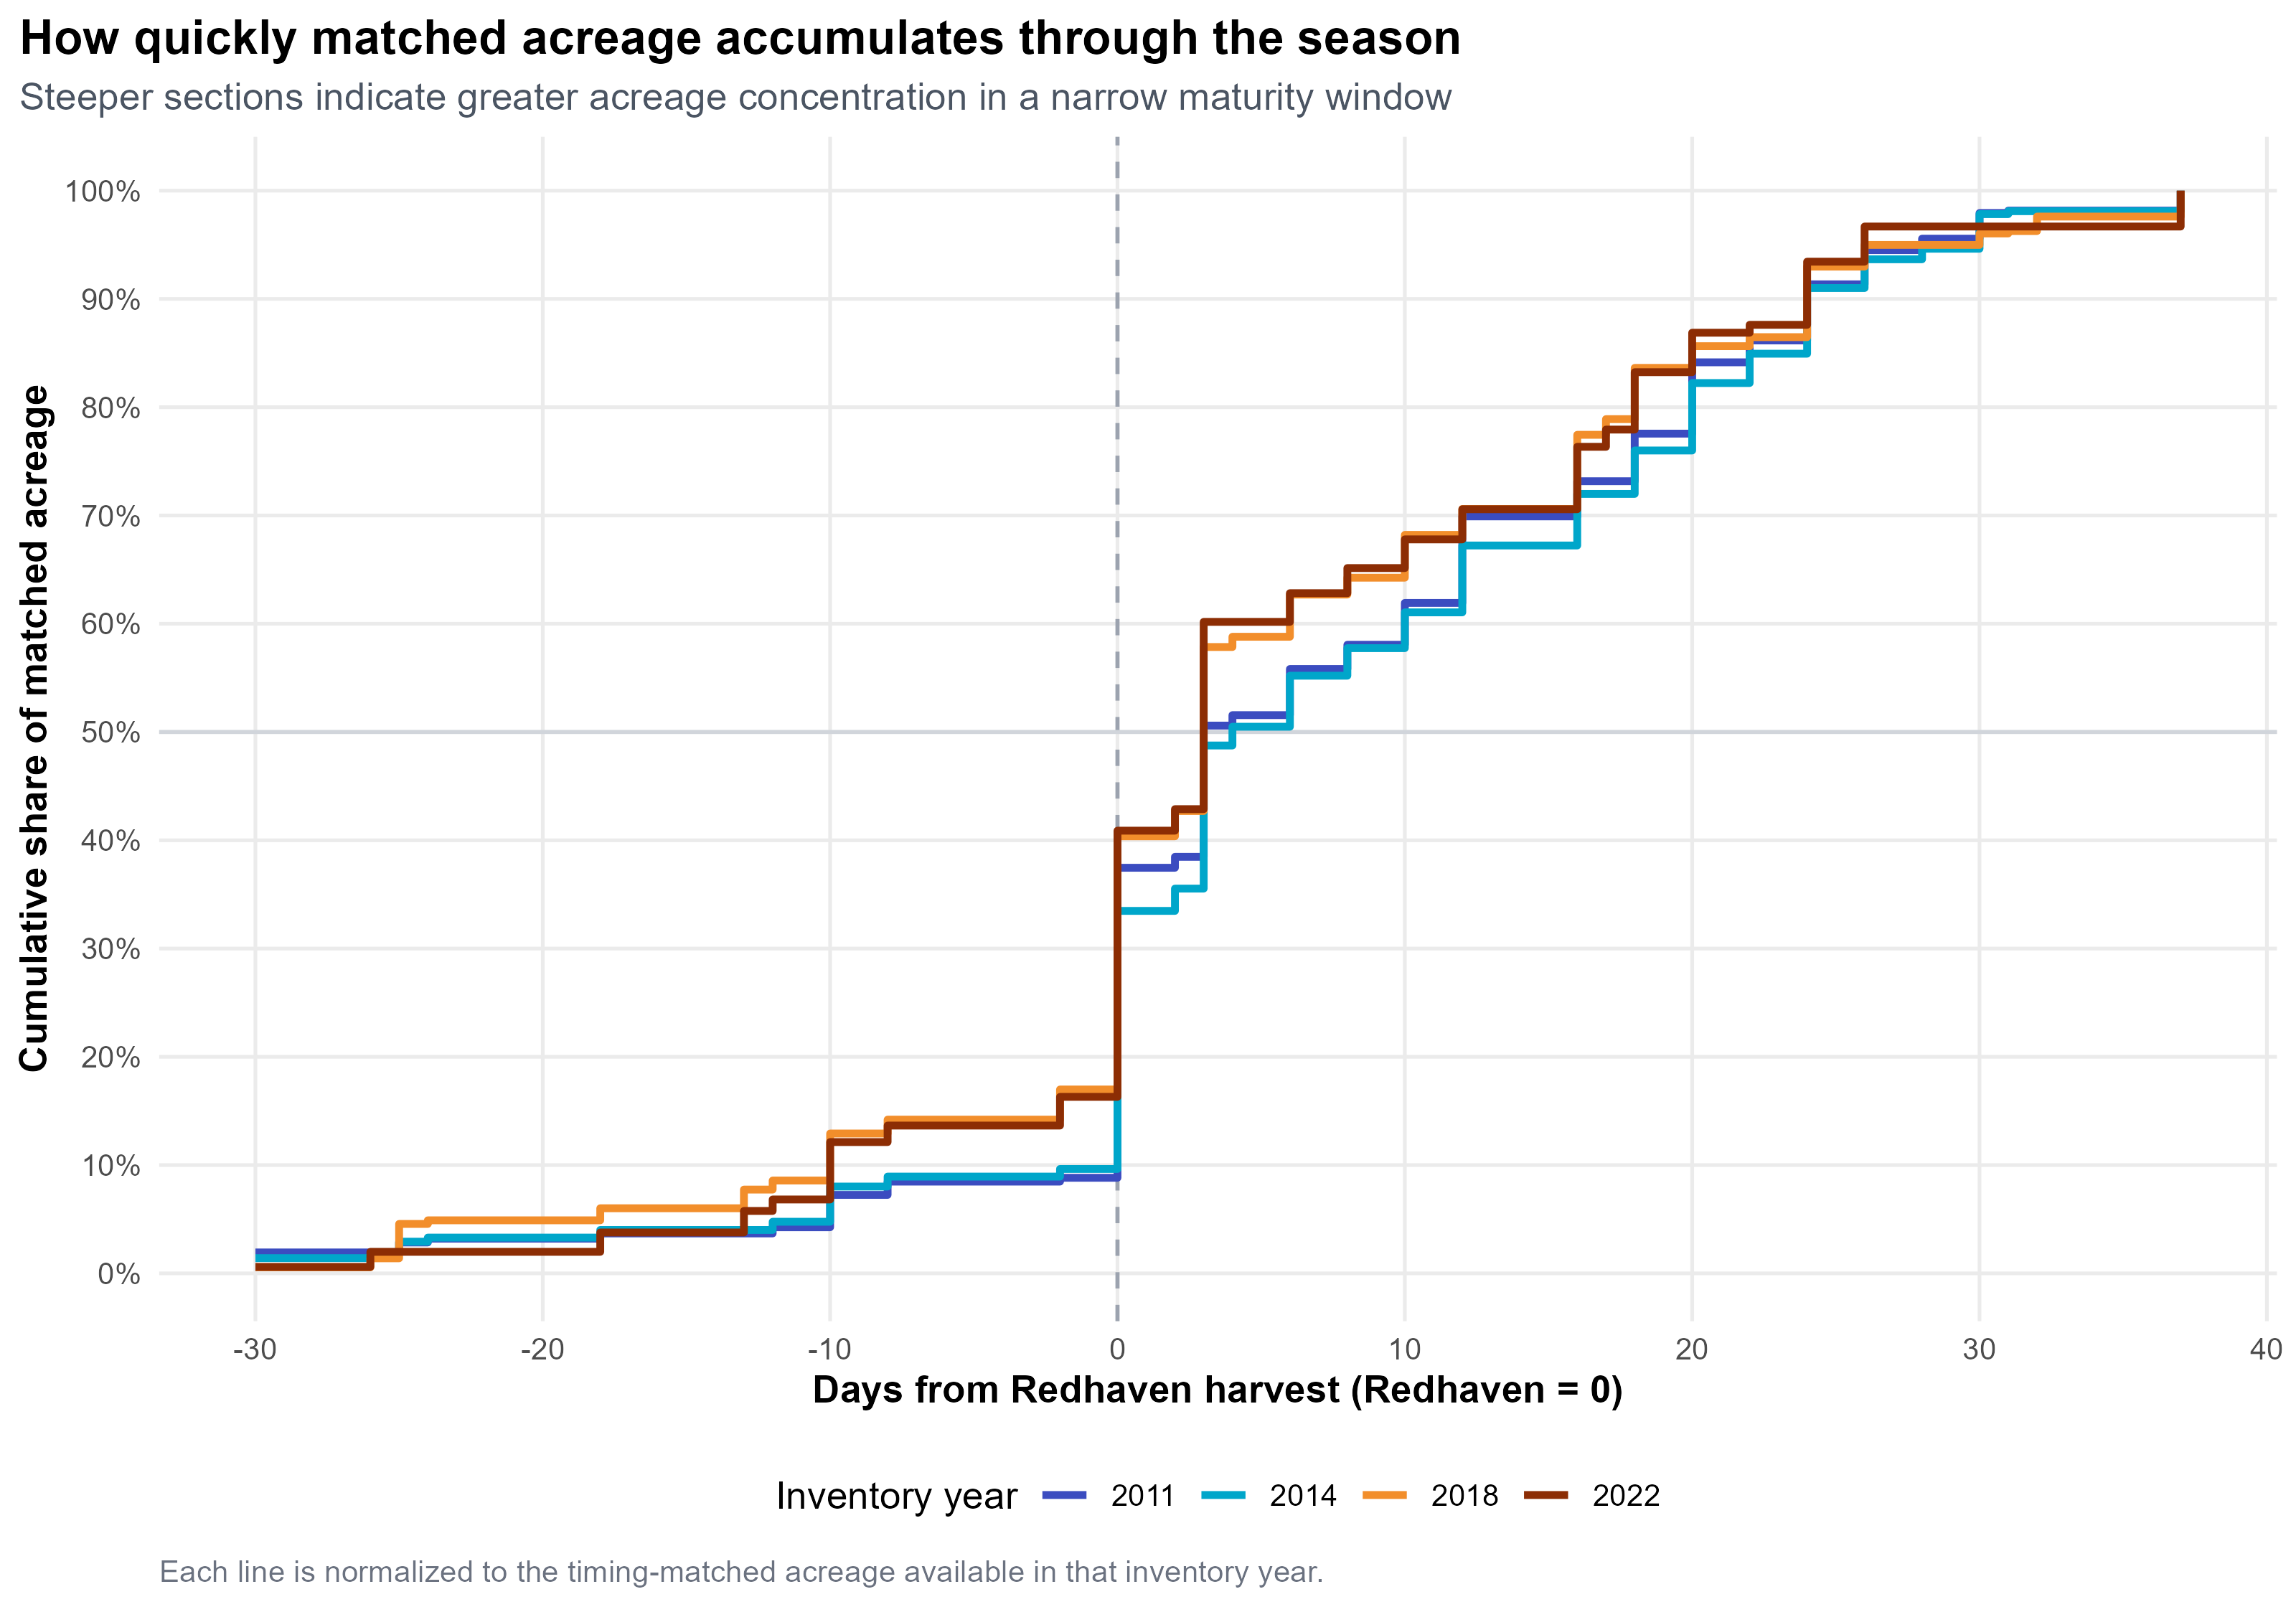
Cumulative acreage through the harvest season
Cumulative acreage through the harvest season. Steeper sections indicate greater acreage concentration in a narrow maturity window.
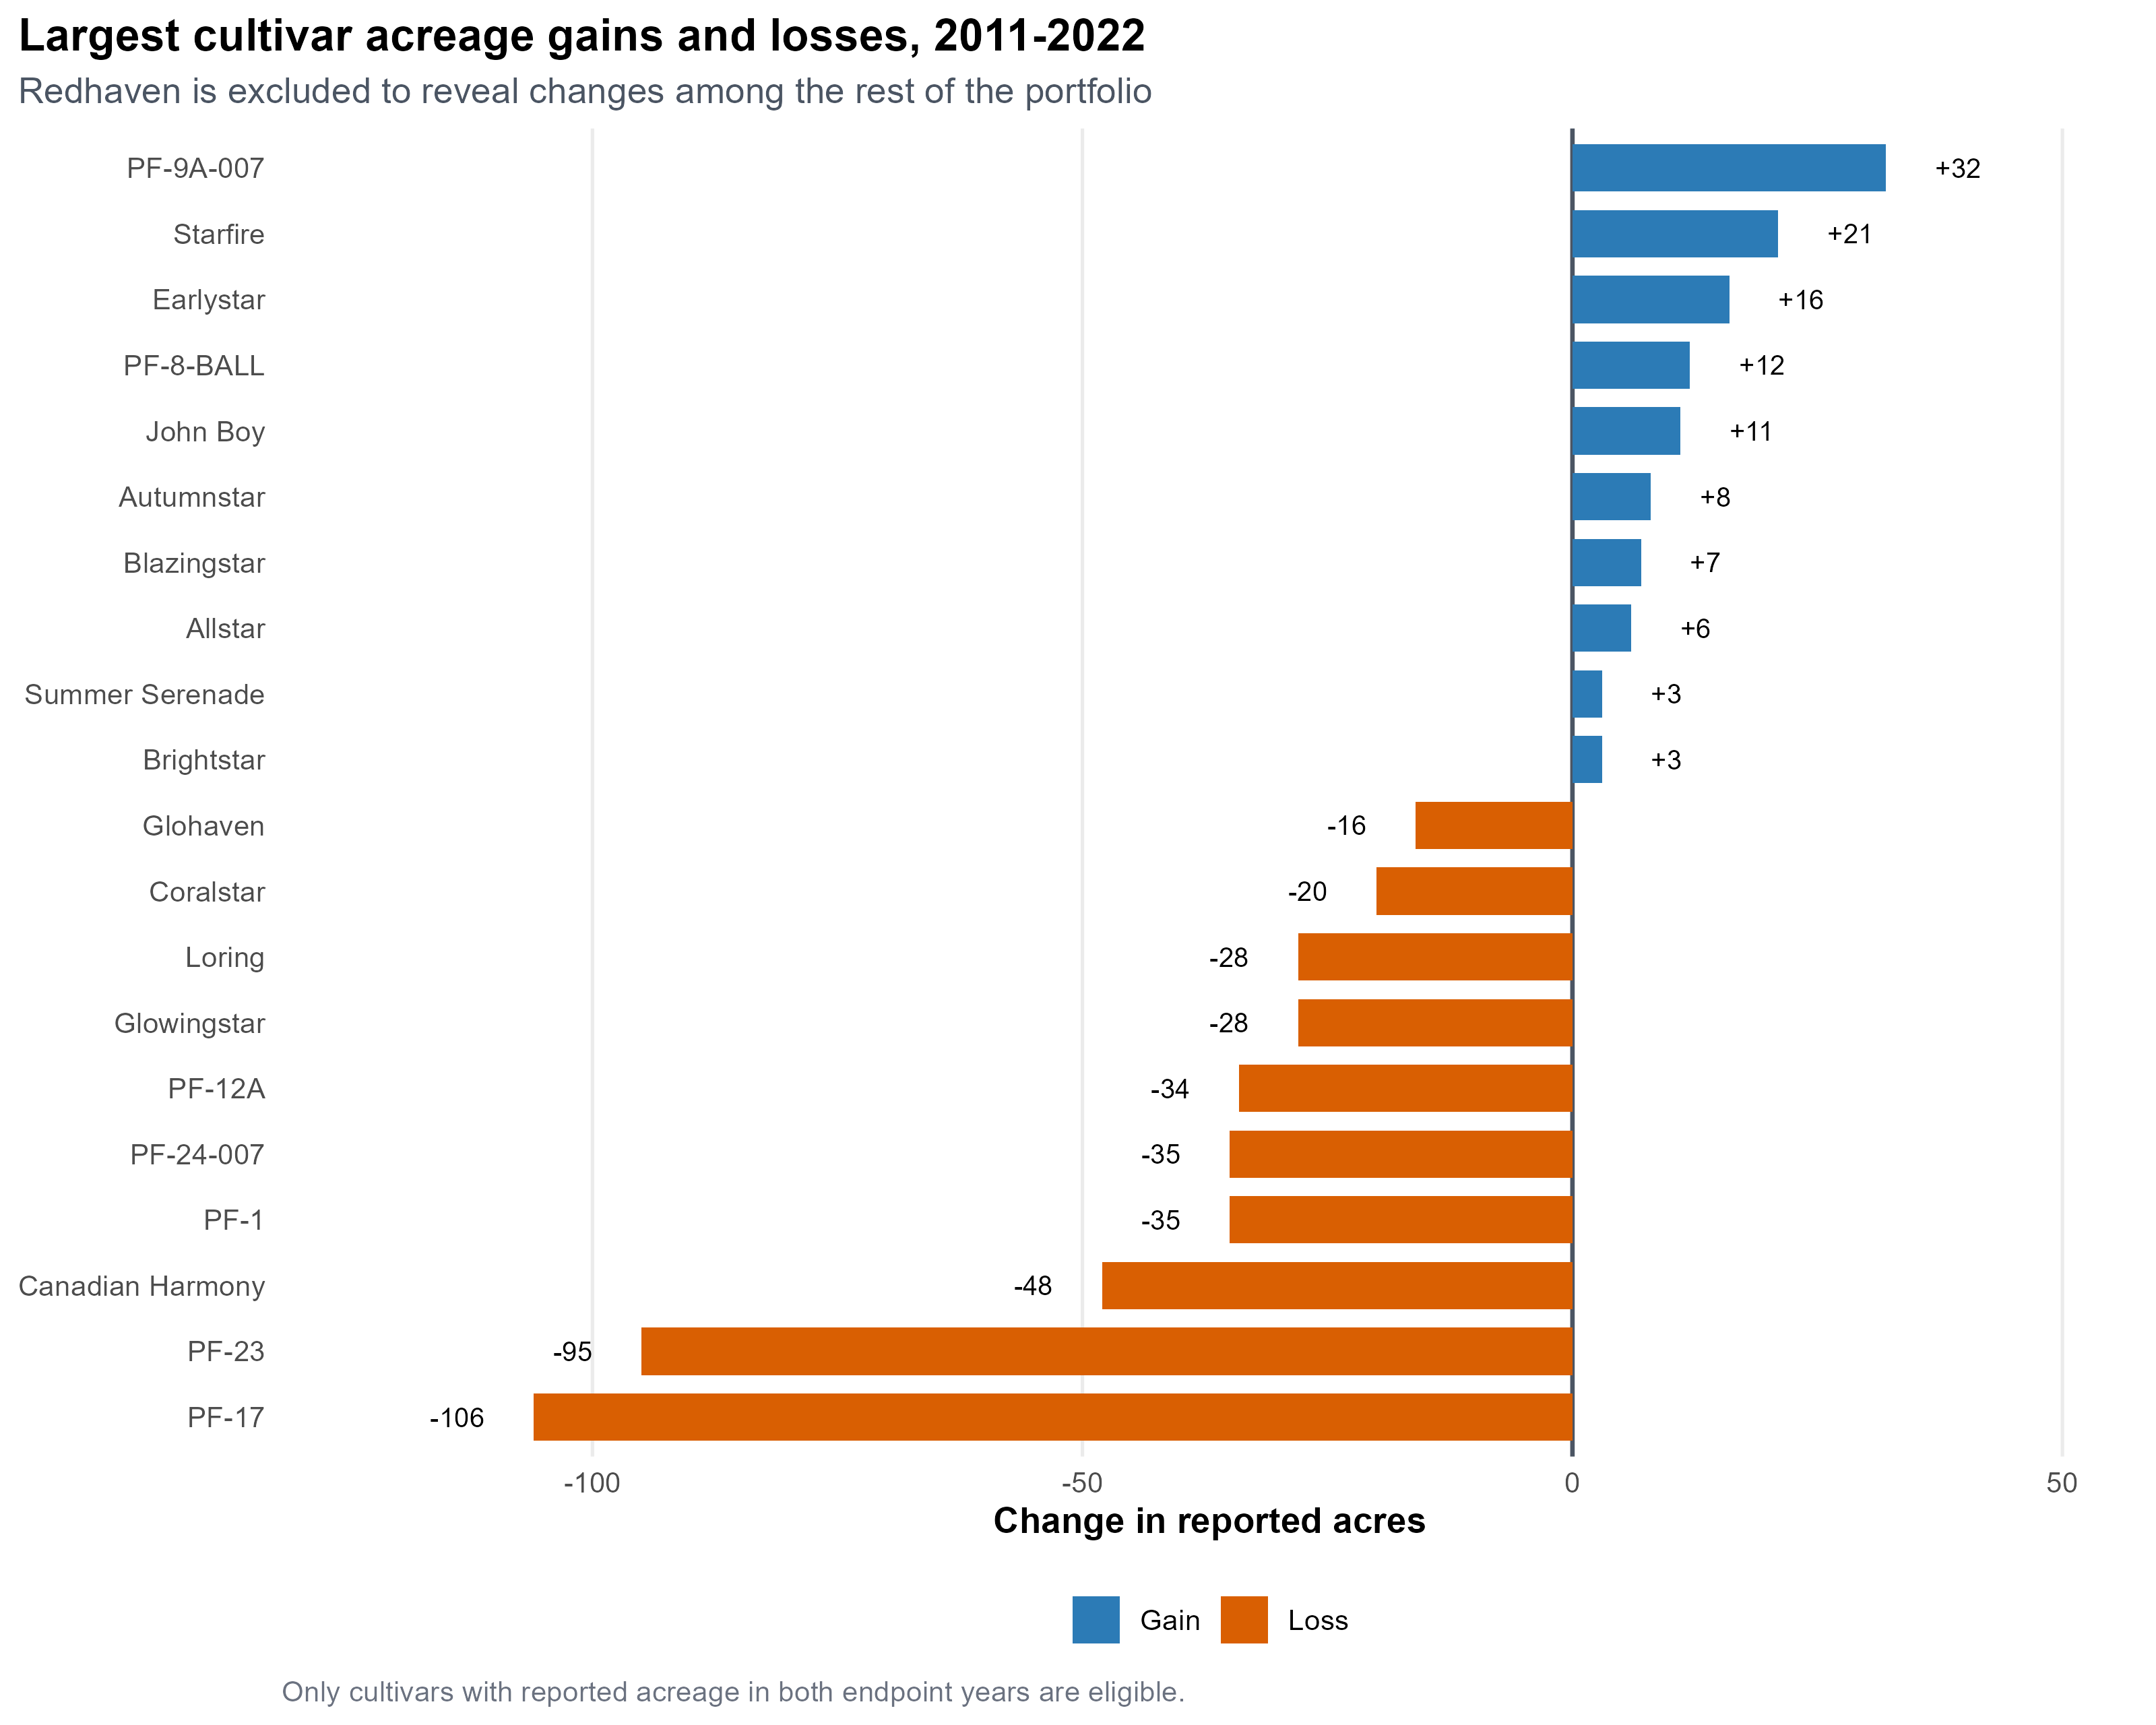
Largest cultivar acreage gains and losses, 2011–2022
Largest cultivar acreage gains and losses, 2011–2022. Redhaven is excluded to reveal changes among the rest of the portfolio.
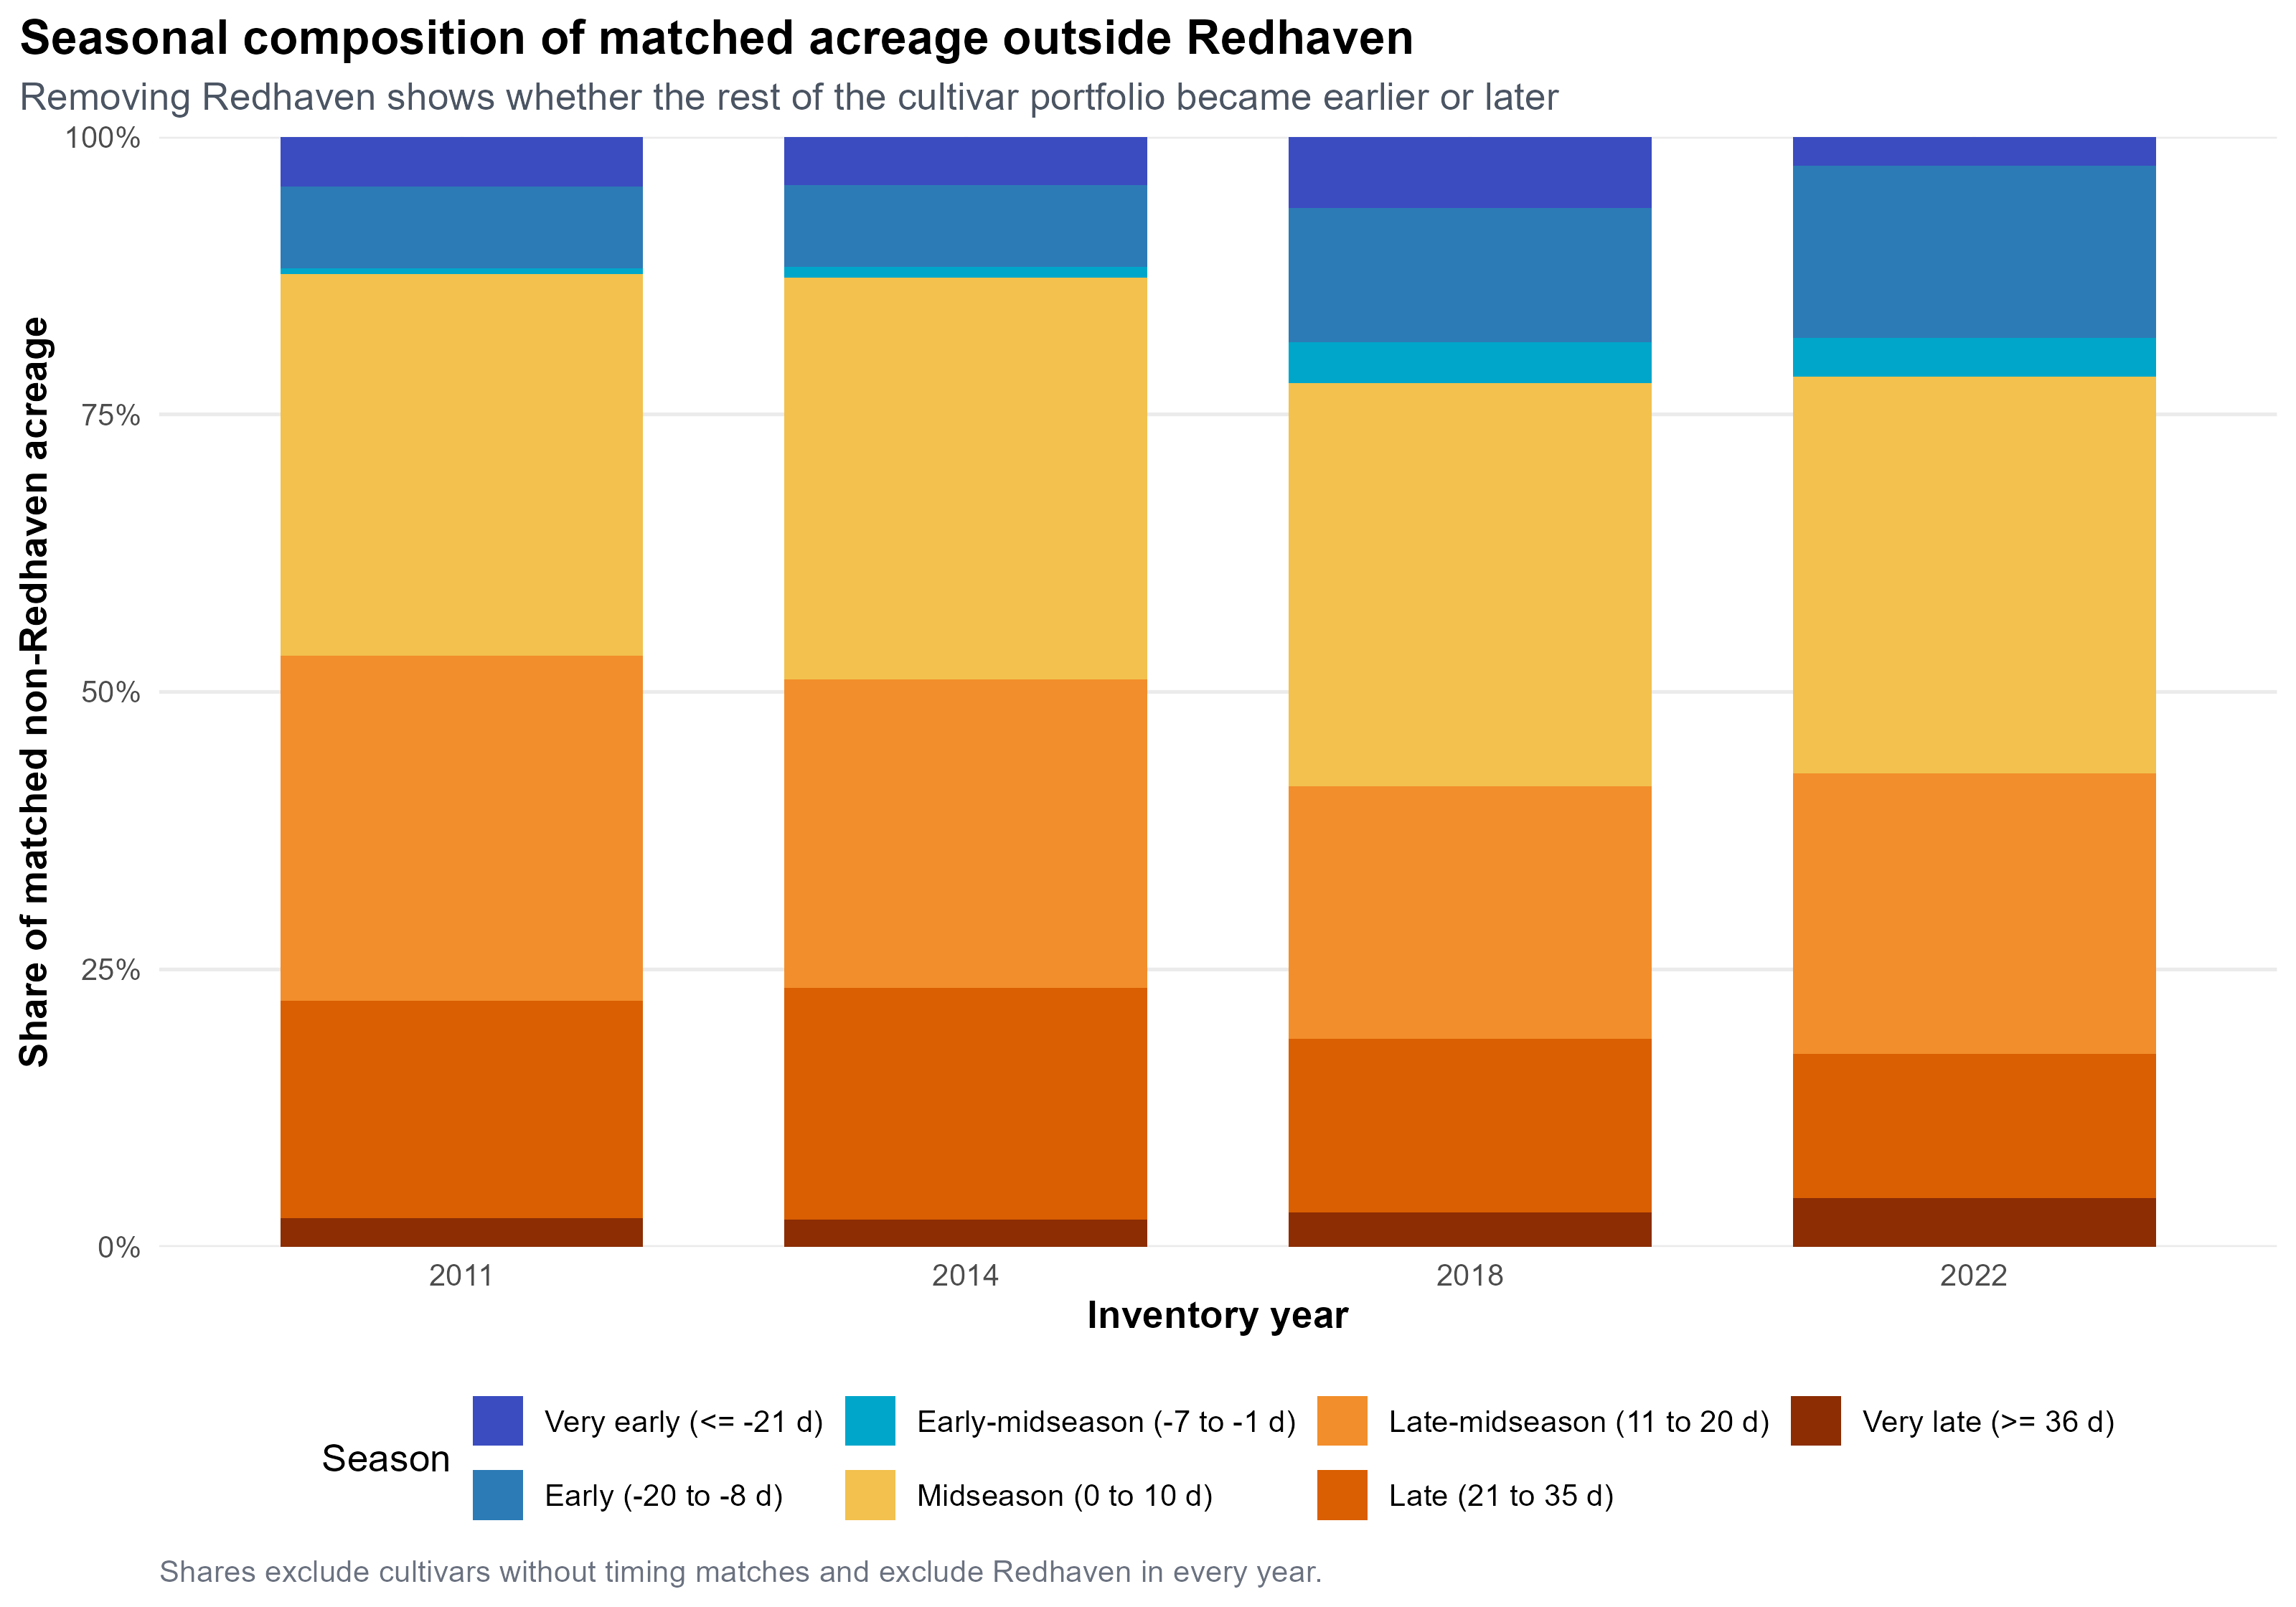
Seasonal mix outside Redhaven
Seasonal mix outside Redhaven. Removing Redhaven shows whether the rest of the cultivar portfolio became earlier or later.